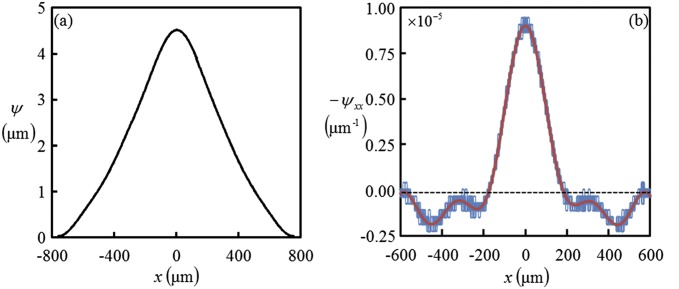
Fig. S3.
Depiction of how the double derivative of the bulged-out profile of the film is estimated. (A) The plot shows a typical trace of the bulged-out profile of a film of thickness , embedded with a channel of diameter , which is filled with nitromethane. (B) The double derivative of the bulged-out profile is calculated using the central difference technique, which results in the oscillatory trace as shown in blue. This trace is then smoothened using an FFT filter to obtain the noise-free double derivative of the profile as represented by the solid red line.

