
Fig. 1.
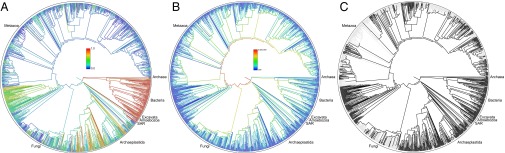
Phylogenies representing the synthetic tree. The depicted tree is limited to lineages containing at least 500 descendants. (A) Colors represent proportion of lineages represented in NCBI databases. (B) Colors represent the amount of diversity measured by number of descendant tips. (C) Dark lineages have at least one representative in an input source tree.