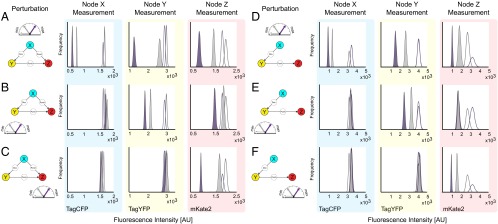
Fig. 4.

Resampling the single-cell flow cytometry data after node-wise perturbations. Forty-eight h after siRNA perturbation, the expression level of the fluorescence reporters that represent nodes X, Y, and Z (TagCFP, TagYFP and mKate2, respectively) are measured using flow cytometry. To calculate the mean fluorescence of each population and the associated uncertainty, bootstrap resampling was performed. The resulting probability distributions of the resampled mean before perturbation (empty) and after perturbation (color-filled) are shown for the feed-forward loop (A–C), and the cascade (D–F). The colors of the peaks indicate the relative strength of the suppression applied (gray is used to indicate the low and purple the high perturbation). (A) The graphical representation of the X-node perturbation and the corresponding nodal responses using the feed-forward architecture. Probability distributions are composed of bootstrapped mean of the fluorescence reporters TagCFP, TagYFP and mKate2 (left to right) following perturbations to node X at two different siRNA concentrations. Color of the peak indicates the relative degree of suppression. (B and C) The graphical representation of the Y- and Z-node perturbations and the corresponding nodal responses using the feed-forward architecture. (D–F) Results from the same process using the cascade architecture.
