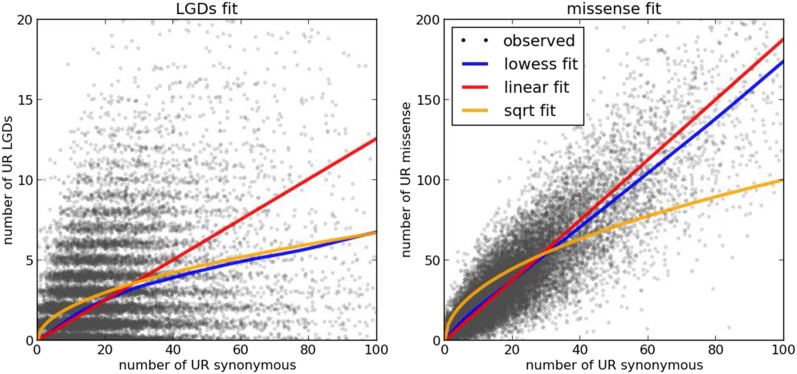
Fig. 1.
Numbers of UR variants per gene. (Left) Numbers of UR synonymous variants (x axis) and UR LGD variants (y axis) found in the parents of the SSC and the EVS database for each of ∼18,000 protein-coding genes that were successfully captured by whole-exome sequencing. (Right) Similar, with the exception that the y axis represents the number of UR missense variants. Random noise is added to the integer counts for better visibility. In addition to the observed counts, the panels show fits to the number of UR synonymous variants: a linear function fit (red line), L = a * S; a square root fit (yellow line), L = b * sqrt(S); and a nonparametric LOWESS fit (blue line). The LOWESS fit agrees closely with the square root model for the number of UR LGD mutations as a function of the number of UR synonymous variants, but it aligns better with the linear fit for the number of UR missense as a function of UR synonymous variants.

