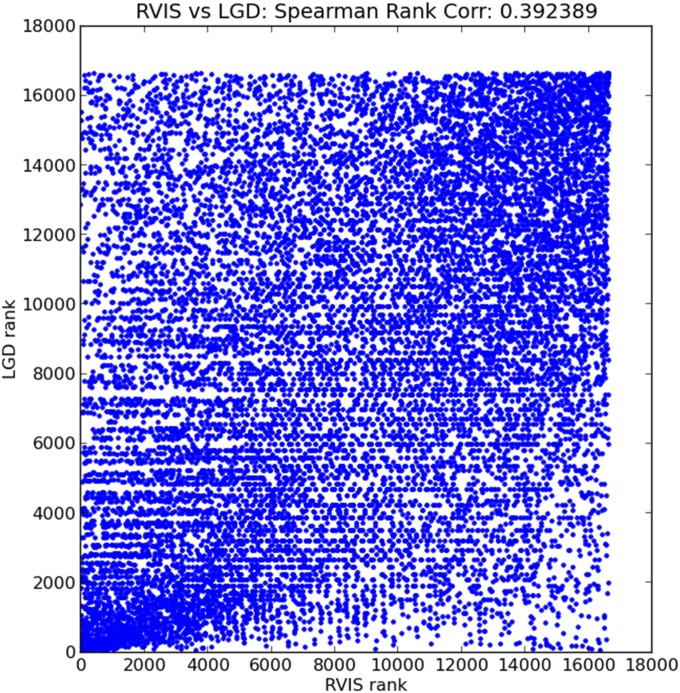
Fig. S3.
Correlation between RVIS and LGD score. We created a per-gene score that reflects the extent to which a gene has a reduced load of UR LGD variants. This score is defined based on the Poisson distribution as the cumulative distribution function of the observed number of UR LGD variants, given the expected number of UR LGD variants, where the expectation is calculated using the LOWESS fit (main text). We ordered the 16,642 genes that had also been assigned an RVIS (13). The figure is a scatterplot of the rank of the UR LGD score (y axis) vs. the rank of RVIS (x axis). The Spearman rank correlation is 0.39.

