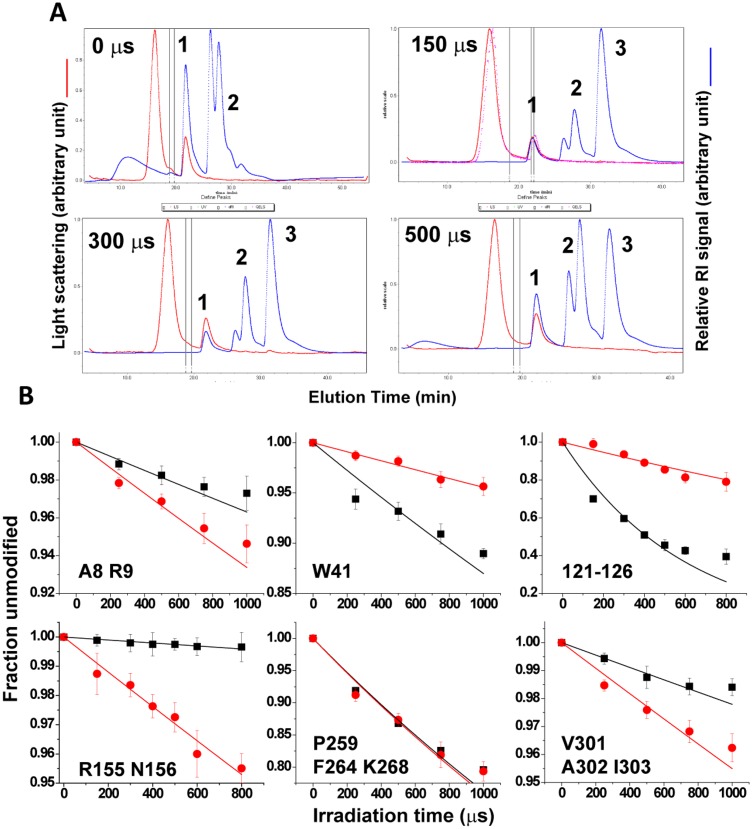
Fig. S5.
(A) SEC-MALS: Chromatogram of MALS (red) and differential refractive index (dRI) (blue) from SEC of “zero” and X-ray irradiated OCPO samples using Ethan LC (GE Healthcare Life Science) coupled to Dawn Heleos MALS detector with an embedded dynamics light scattering detector and Optilab rEX dRI detector (Wyatt Technology Corp.). The data shown are directly from the Astra software. The scattering signal indicates no change in peak characteristics of the major component, OCP-monomer (peak “1”) upon X-ray irradiation. The dRI signal indicates presence of buffer components (peak “2” in all of the samples) and methionine amide (peak “3” in the irradiated samples). (B) Representative XF-MS dose–response plots: peptide modification as a function of X-ray irradiation dose for residue and residues clusters of OCPO, (black squares) and illuminated OCPR, (red circles). Error bars represent the SE from three independent measurements. The solid lines represent single-exponential fits to the dose-dependent data. The ratio of the modification rates (R) indicates the change in relative accessibilities, which are shown in Table S6.

