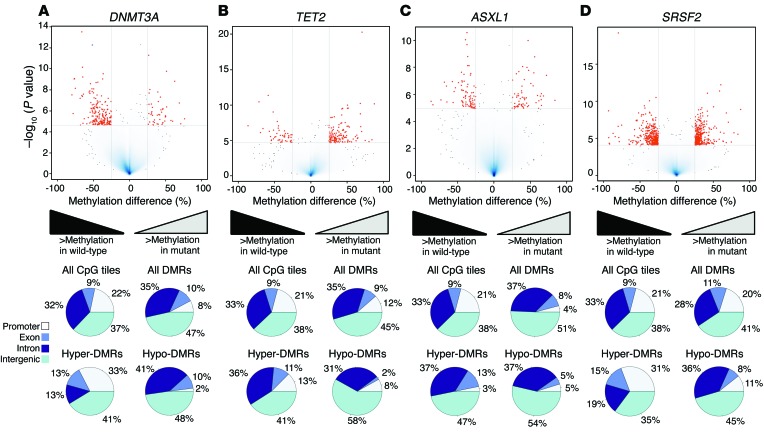
Figure 2. Distinct DNA methylation profiles are associated with recurrent somatic mutations in DNMT3A, TET2, ASXL1, and SRSF2.
Volcano plots illustrating the methylation differences between DNMT3A-mutant (n = 5) (A), TET2-mutant (n = 17) (B), ASXL1-mutant (n = 15) (C), or SRSF2-mutant (n = 21) (D) samples versus WT patients (n = 39 for the number of mutated samples). DMRs are indicated by red dots (beta-binomial test, FDR <0.1 and absolute methylation different ≥25%). Pie charts illustrate the relative proportion of CpG tiles and DMRs annotated to the RefSeq promoter, exonic, intronic, and intergenic regions.

