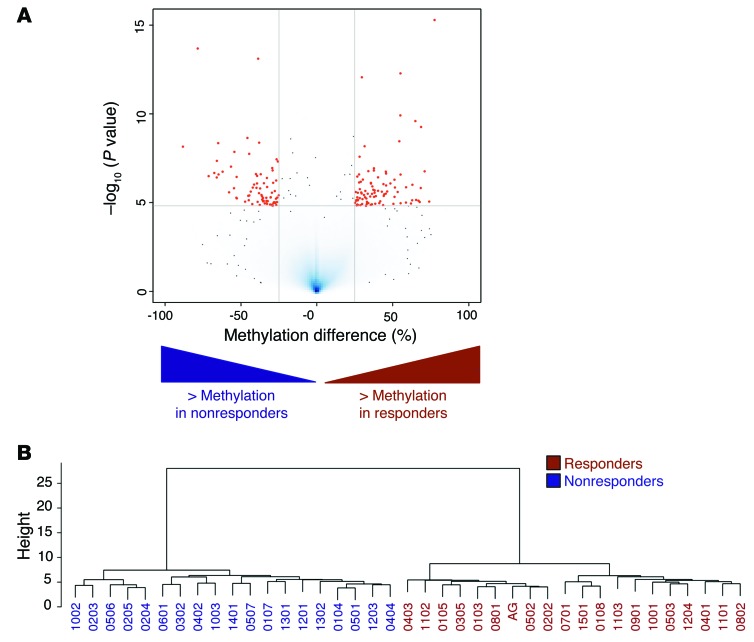
Figure 3. Baseline DNA methylation differences distinguish DAC responders and nonresponders at the time of diagnosis.
(A) Volcano plot illustrating methylation differences between 20 DAC-sensitive and 19 DAC-resistant patients. Mean methylation difference between the 2 groups is represented on the x axis and statistical significance (–log10 P value) on the y axis. Beta-binomial test identified 167 DMRs, which are indicated by red dots (FDR <0.1 and absolute methylation difference ≥25%). (B) Hiearchical clustering of the patients using the 167 DMRs illustrates the power of these genomic regions in segregating the patients into nonresponder (blue) and responder (red) groups.

