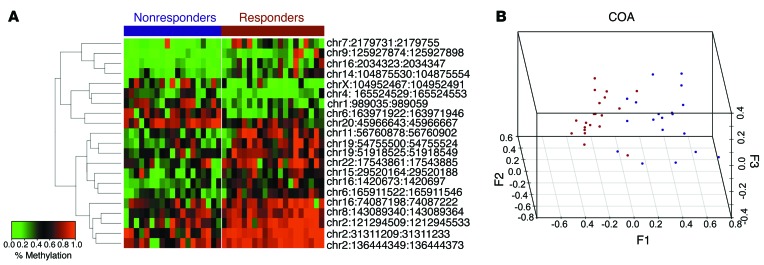
Figure 5. Methylation profiles can be harnessed to classify patients according to DAC response at diagnosis.
(A) Heatmap of 21 CpG tiles selected as the SVM classifier predictors. DAC-sensitive patients are indicated with the red bar and nonresponders with the blue bar. (B) Correspondence analysis (COA) using only the 21 CpG tiles included in the classifier could segregate the majority of the CMML cohort according to DAC response (responders are represented by red dots and nonresponders by blue dots).

