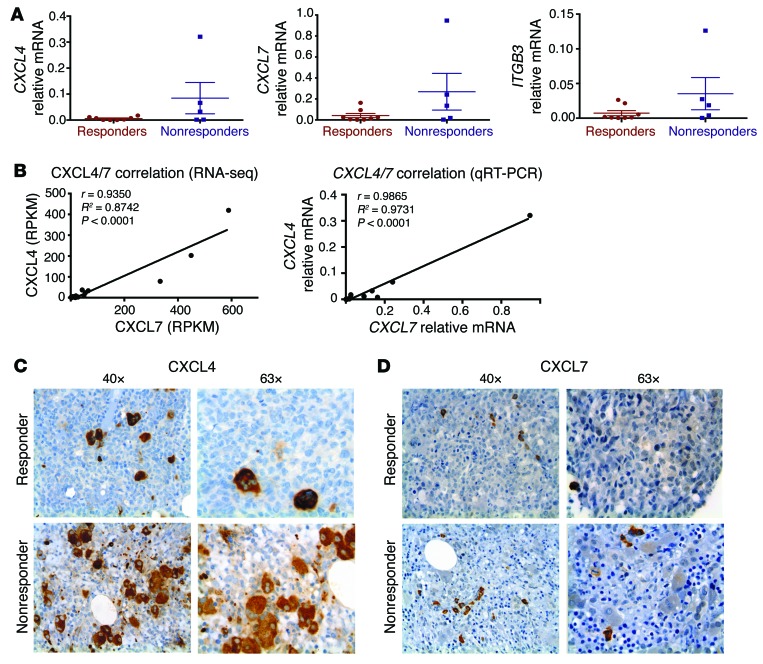
Figure 7. CXCL4 and CXCL7 are upregulated in the BM of nonresponders.
(A) qRT-PCR showing validation of overexpression of CXCL4, CXCL7, and ITGB3 in nonresponders; each point represents the mean of triplicate wells for each patient sample; the line and error bars indicate the group mean and SD, respectively. (B) Pearson’s correlation analysis of expression levels of CXCL7 and CXCL4 by RNA-seq and qRT-PCR. (C and D) Representative IHC images for CXCL4 (C) and CXCL7 (D) in diagnostic BM biopsies in DAC responders and nonresponders. Original magnification, ×40 (C and D, left panels), ×63 (C and D, right panels). Representative images from duplicate experiments are shown.

