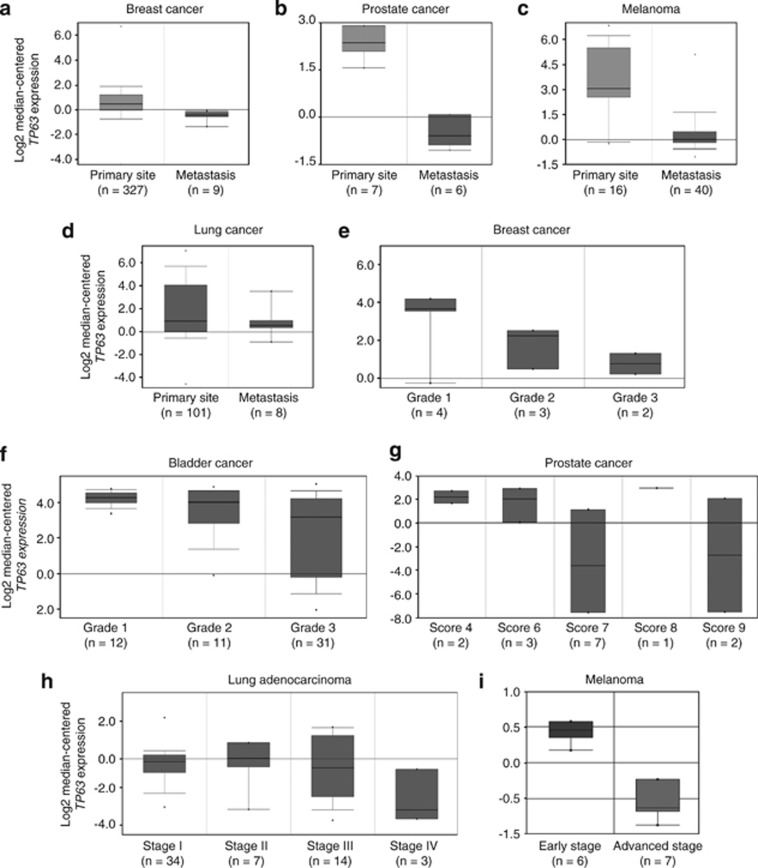
Figure 1.
P63 expression inversely correlates with cancer progression in human cancers. Box plots representing p63 gene (TP63) expression from microarray analysis of human tumor biopsy samples. The top and bottom of each box represent the first and third quartiles, and the band inside the box represents the median value. The error bars represent 1 S.D. above and below the mean value. Oncomine (Compendia Bioscience) was used for analysis and visualization. (a–d) Clinical specimens removed from primary tumor (primary site) or metastatic nodule (metastasis). (a) Bittner breast data set. Fold change: −2.168; P=2.00e−5. (b) Verambally Prostate data set. Fold change: −7.334; P=3.54e−8. (c) Riker Melanoma data set. Fold change: −7.005; P=7.26e−5. (d) Bittner Lung data set. Fold change: −2.231; P=0.026. (e–g) Tumor biopsies were classified pathologically by grade. (e) Ma Breast 4 data set. (f) Stransky Bladder data set. (g) Luo Prostate 2 data set. Data were classified by Gleason score. (h and i) Samples were classified pathologically by tumor stage. (h) Bild Lung data set. (i) Smith Skin data set

