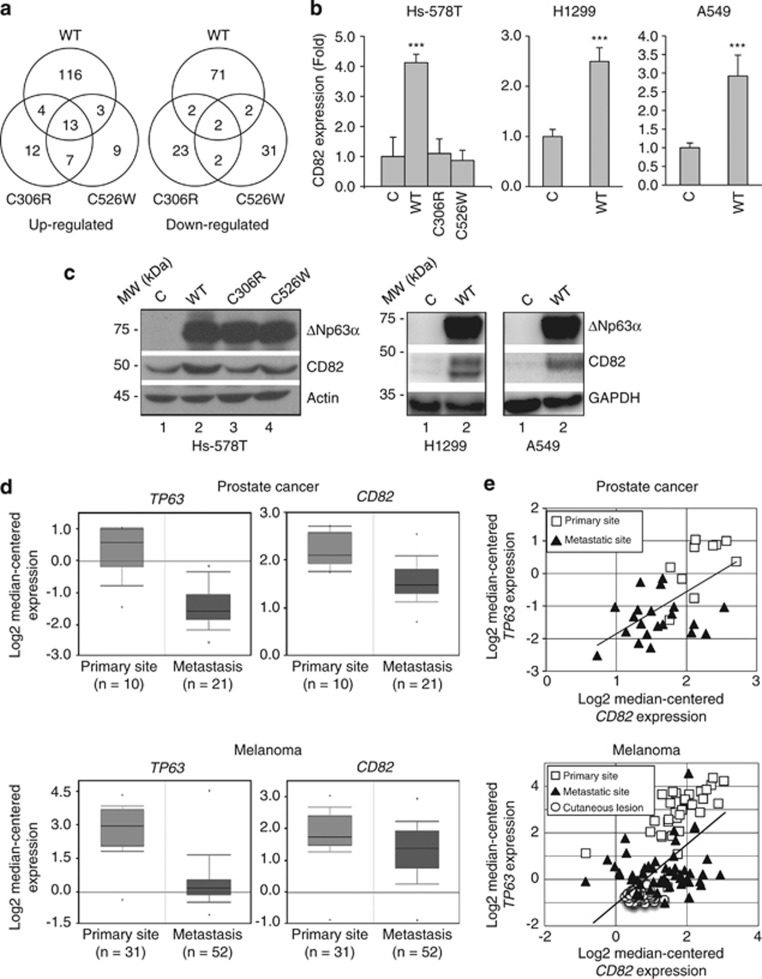
Figure 3.
ΔNp63α upregulates CD82 expression. Stable Hs-578T cells expressing WT murine ΔNp63α (WT), a mutant derivative (C306R or C526W), or a vector control (C) as described in Figure 2 were used. (a) Stable cells were subjected to gene expression profiling using Affymetrix human genome U133A 2.0 arrays in two independent arrays. A P-value lesser than 0.05 was used as the cutoff for significance, and genes exhibiting ≥2-fold changes compared with the vector control were selected (also see Supplementary Figure S1 and Supplementary Tables S1–3). Venn diagrams indicate the number of upregulated (left) and downregulated (right) genes for each ΔNp63α construct (WT, C306R or C526W). Note that expression of some genes overlaps, whereas that of other genes are uniquely regulated. (b) Stable cells were subjected to Q-PCR analysis for CD82 expression. Results are presented as means and S.E. from three independent experiments performed in triplicate. ***P<0.001. (c) Stable cells were subjected to western blotting, as indicated. (d and e) P63 (TP63) and CD82 gene expression from microarray analysis of human tumor biopsy samples from Chandran Prostate data set and Xu Melanoms data set. Oncomine (Compendia Bioscience) was used for analysis and visualization. (d) Box plots representing TP63 and CD82 expression. The top and bottom of each box represent the first and third quartile, and the band inside the box represents the median value. The error bars represent 1 S.D. above and below the mean value. For prostate cancer samples (top panels): TP63 fold change: −3.194, P=3.07e−5. CD82 fold change: −1.534, P=9.11e−5. For melanoma samples (lower panels): TP63 fold change: −5.582, P=6.43e−16. CD82 fold change: −1.413, P=0.002. (e) Correlation analysis between TP63 and CD82 expression in prostate cancer samples (top panel; r=0.603, P=3.30e−4) and melanoma samples (lower panel; r=0.615, P<1.0e−5). Statistical significance was assessed by Pearson's correlation coefficient (r) followed by a two-tailed probability test (P-value)

