Figure 8.
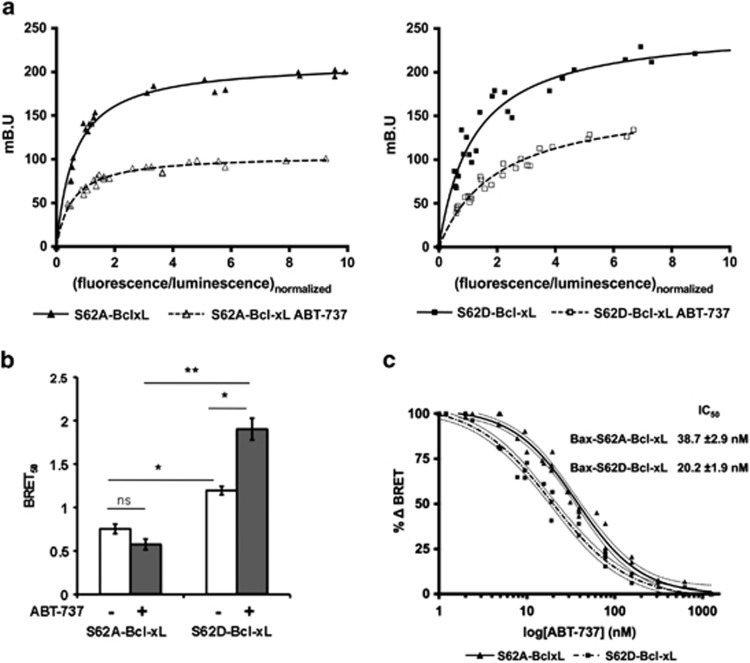
Quantitative BRET analysis indicated that serine 62 phosphorylation of Bcl-xL weakened Bax/Bcl-xL interactions upon ABT-737 treatment. (a) Donor saturation assay analysis: saturation curves were performed on MCF-7 cells using increasing amount of vectors encoding S62A- or S62D-YFP-Bcl-xL (triangle and square, respectively) in the presence of a fixed amount of the vector-encoding Rluc-Bax in the presence (full symbol and line) or not (empty symbol and dashed line) of ABT-737 (1 μM). BRET ratios (mB.U, milliBRET Unit) are measured for every YFP-Bcl-xL plasmid concentrations and are plotted as a function of the ratio of total acceptor to donor fluorescence (YFP-Bcl-xL/Rluc-Bax, normalized on the ratio obtained for 100 ng YFP-Bcl-xL). The data were fitted using a nonlinear regression equation assuming a single binding site. Data shown represent results from one of three separate BRET titration experiments (performed in duplicate) that produced quantitatively similar results. (b) BRET50 for S62A- or S62D-YFP-Bcl-xL/Rluc-Bax treated or not with ABT-737 (1 μM) was calculated from the saturation curves showed in the Supplementary Figure 2. (c) Dose–response effect of ABT-737 on disruption of S62A- or S62D-Bcl-xL/Rluc-Bax complexes. MCF-7 cells were transiently transfected with a constant amount of plasmid DNA encoding the donor Rluc-Bax (50 ng) and plasmid DNA encoding the acceptor S62A- or S62D-YFP-Bcl-xL (200 ng), treated or not with increasing dose of ABT-737 (1 to 1000 nM). %ΔBRET is plotted as a function of the semi-logarithmic ABT-737 concentrations. The data were fitted using a nonlinear regression, which provided the IC50, the concentration of ABT-737 inhibitor where the BRET signal for a fixed ratio response is reduced by half

