Figure 3.
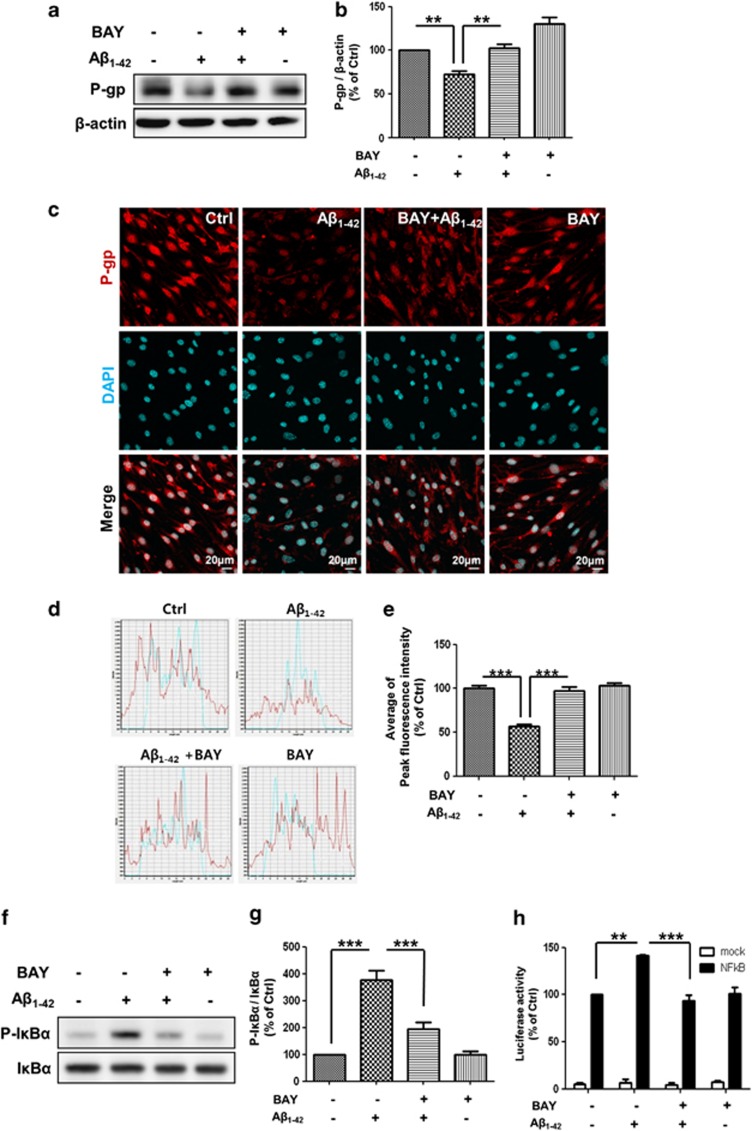
The nuclear factor-kappa B (NF-κB) pathway mediated the Aβ1–42-induced decrease in P-gp expression. (a) Western blot analysis of the P-gp contents in bEnd.3 cells that were incubated with 5 μM of Aβ1–42 for 24 h with or without 5 μM of BAY 11-7082. (b) The histogram represents the densitometric analysis of the blots, with the data expressed as mean±S.E.M. (n=4; **P<0.01 versus Aβ 5 μM). (c) Confocal microscopic analysis of the P-gp intensity in the bEnd.3 cells that were treated with 5 μM of Aβ1–42 for 24 h with or without 5 μM of BAY 11-7082. The nuclei were labeled with DAPI (blue), and P-gp was immunofluorescently labeled in red. Scale bar=20 μm. (d) The fluorescence intensity profile of each imaged cell that was determined by drawing lines parallel to the axis of the cell. The x-axis shows the length of the line, which was ∼30 μm in total, and the y-axis shows the intensity. The red line shows the intensity of P-gp, and the blue line shows that of DAPI. (e) The average peak fluorescence intensity of P-gp is presented. The peak fluorescence intensity values were taken from 10 cells per group from three independent preparations (***P<0.001 versus Aβ 5 μM). (f) The p-IκBα protein levels were measured by a western blot analysis in bEnd.3 cells that were incubated with 5 μM of Aβ1–42 for 15 min with or without 5 μM BAY 11-7082, alongside total IκBα. (g) The histogram shows a densitometric analysis of the blots, with the data expressed as mean±S.E.M. (n=4; ***P<0.001 versus Aβ 5 μM). (h) NF-κB response element luciferase gene reporter assay done in bEnd.3 cells that were treated with Aβ1–42 for 30 min in the presence or absence of BAY 11-7082 (n=3; **P<0.01, ***P<0.001 versus Aβ 5 μM)

