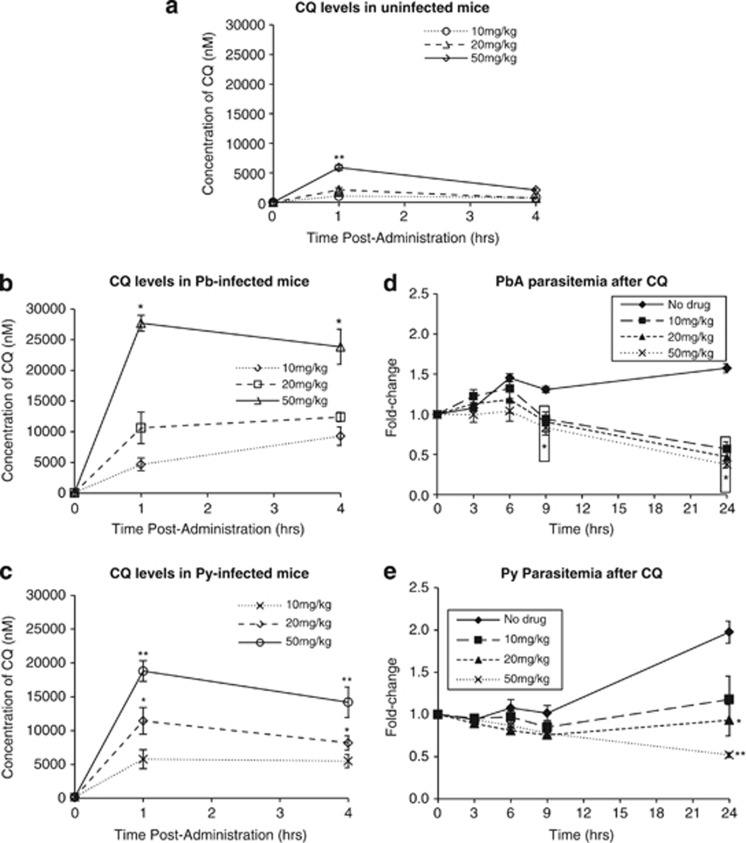
Figure 6.
CQ pharmacokinetics and pharmacodynamics. The whole-blood concentration of CQ in (a) uninfected, (b) P. berghei-infected and (c) P. yoelii-infected mice fed with 10, 20 or 50 mg/kg of CQ at 1 or 4 h postadministration. *P<0.05 or **P<0.01 when compared with 10 mg/kg mice at the same time point, with point-specific P-values provided in Supplementary Figure S3. Parasitemia change of mice infected with (d) P. berghei or (e) P. yoelii after a single oral dose of 10, 20 or 50 mg/kg of CQ. *P<0.05 or **P<0.01 when compared with no-drug control mice at the same time point, with point-specific P-values provided in Supplementary Figure S4

