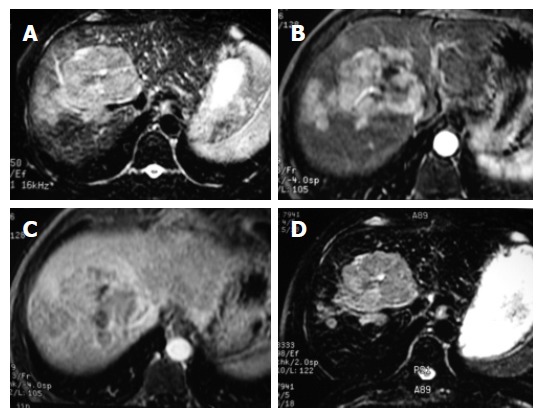
Figure 3.

HCC image. A: The lesion appears hyperintense on the pre-contrast T2WI FSE image, but is not clearly delineated; B: The lesion is markedly enhanced during the hepatic arterial phase; C: The lesion appears hypointence during the portal venous phase, but is not clearly delineated; D: The main lesion and satellite nodules are clearly delineated from the surrounding hypointense liver parenchyma on the ferucarbotran-enhanced T2WI image during the accumulation phase.
