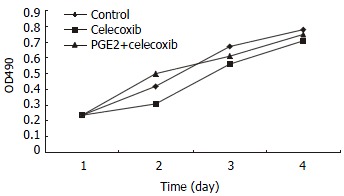
Figure 3.

Growth curves of SK-CHA-1 cells in the presence of celecoxib, celecoxib + PGE2 and control group. The proliferation of SK-CHA-1 cells was inhibited slightly by celecoxib, the cell density OD490 in the presence of celecoxib and in control group was 0.31 ± 0.04 and 0.42 ± 0.03 respectively on day 2 (P > 0.05), 0.58 ± 0.07 and 0.67 ± 0.09 respectively on day 3 (P > 0.05), and 0.71 ± 0.08 and 0.78 ± 0.06 respectively on day 4 (P > 0.05).
