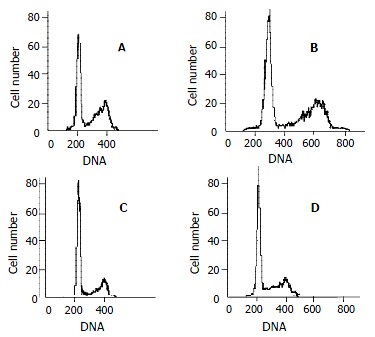
Figure 4.

Cell cycle analysis. Representative flow cytometry data from QBC939 cells after 48 h in the presence of various concentration of celecoxib: 0 μmol/L (A), 10 μmol/L (B), 20 μmol/L (C) and 40 μmol/L (D). The percentage of QBC939 cells in G0-G1 phase after treatment with 40 μmol/L (74.66 ± 6.21) and 20 μmol/L (68.63 ± 4.36) of celecoxib increased significantly compared with control cells (t test, P < 0.01).
