
Figure 2.
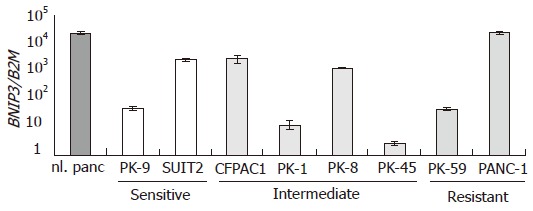
Relative expression levels of BNIP3 in eight pancreatic cancer cell lines. BNIP3 expression in pancreatic cancer cell lines as determined by quantitative real-time RT-PCR, and the expression of B2M was monitored as the internal control. The cell lines are arranged by IC50 for gemcitabine. No significant correlation was observed between the expression level of BNIP3 and IC50.