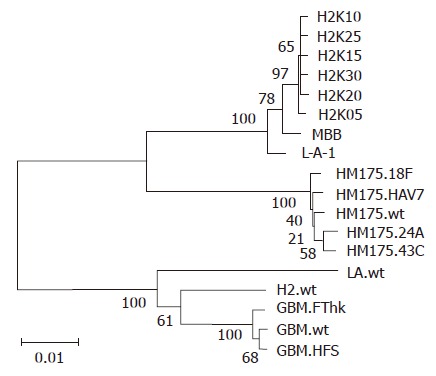
Figure 2.

Phylogenetic analysis of the complete VP1 region using MEGA software package version 3.1. The numbers at nodes indicate bootstrap percentages after 1000 replications of bootstrap sampling. The bar indicates genetic distance.

Phylogenetic analysis of the complete VP1 region using MEGA software package version 3.1. The numbers at nodes indicate bootstrap percentages after 1000 replications of bootstrap sampling. The bar indicates genetic distance.