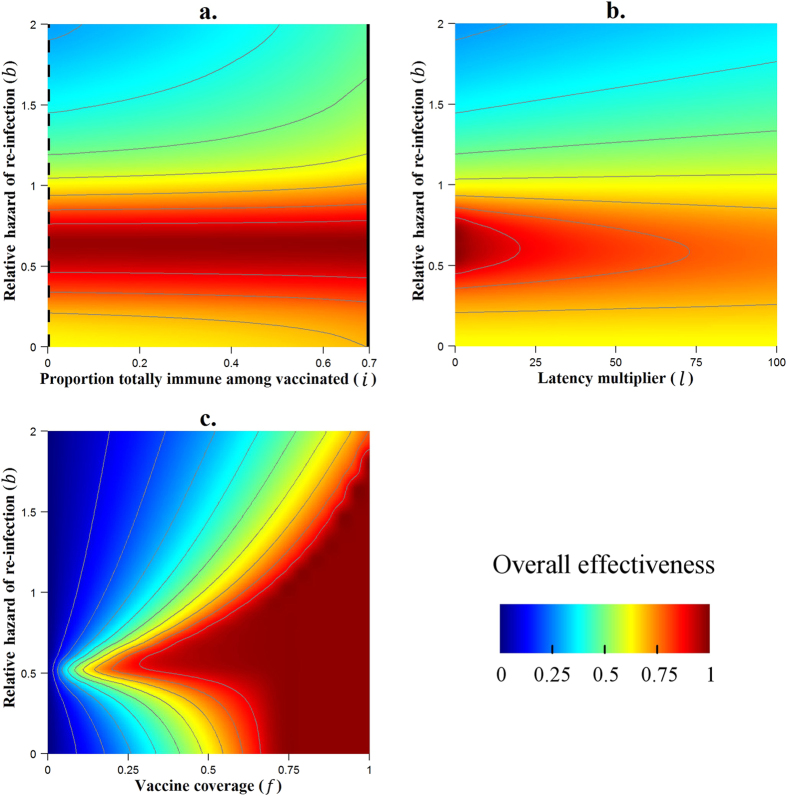
Figure 4. Results of the variation of the risk of re-infection (b) paired with variations of other parameters (i, l and f) on overall effectiveness.
The thin grey contour lines connect points at which overall effectiveness takes the same value, with each successive line separated by a difference of 10% in effectiveness. Continuous black lines indicate the ‘all or nothing’ vaccine configuration, while dashed black lines correspond to fully ‘leaky’ vaccines. In panels (b,c) a ‘leaky’ vaccine is considered.

