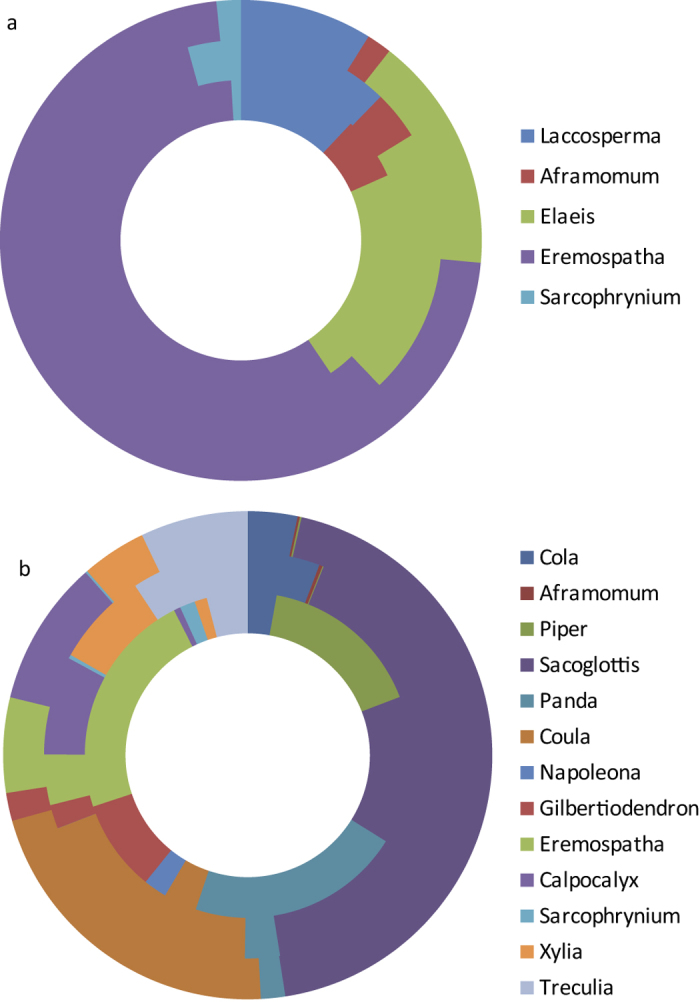
Figure 4. Microremain assemblages recovered in calculus.

Microremain counts are normalised by dividing counts by the percent content of dry plant weight of starches and phytoliths among different genera. (a) Phytolith counts compared with feeding records. Outermost ring = proportions of minutes spent consuming each genus averaged across the feeding records of sampled 24 sampled chimpanzees, middle ring = proportions of minutes spent consuming each genus averaged across the feeding records of all 128 chimpanzees, innermost ring = phytolith counts from the sampled 24 chimpanzees. (b) Starch counts compared with feeding records: outermost ring = proportions of minutes spent consuming each genus averaged across the feeding records of sampled 24 chimpanzees, middle ring = proportions of minutes spent consuming each genus averaged across the feeding records of all 128 chimpanzees, innermost ring = starch counts.
