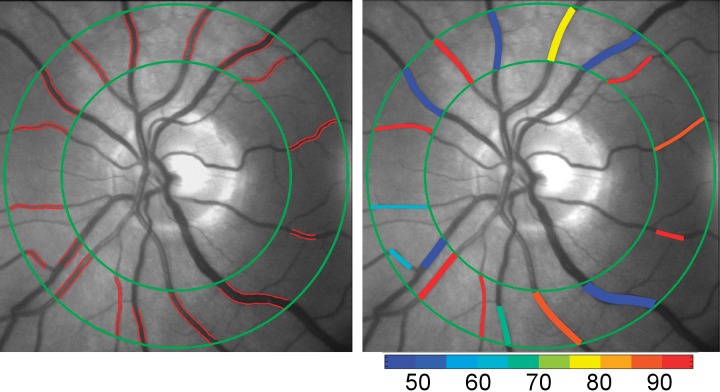
Figure 2.
Example of a retinal image displaying vessel boundaries (red lines), obtained from multiple diameter measurements along blood vessels within a circumpapillary region of interest enclosed by two concentric green circles (left). Mean retinal vascular oxygen saturation measurements overlaid on the retinal image in pseudocolor (right). Color bar indicates oxygen saturation in percent.

