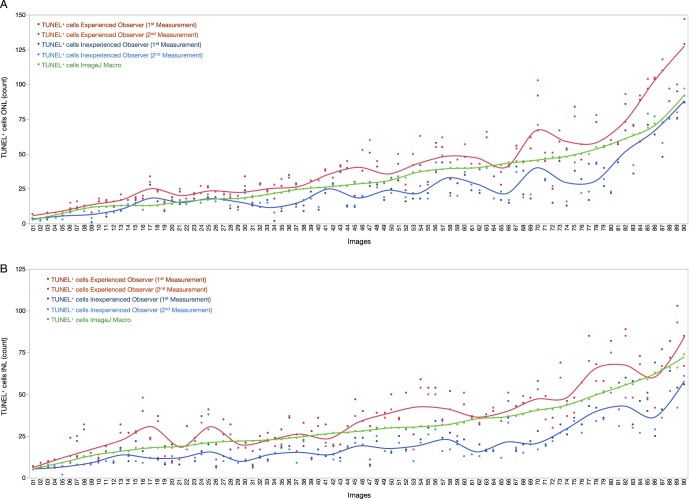
Figure 2.
TUNEL-positive cell counts for the macro and mean values of inexperienced and experienced observers. Cell counts for the ImageJ macro and first and second measurements from observers plotted for every image, for ONL (A) and INL (B) datasets. A colored trendline represents mean variations for each observer. Macro TUNEL+ counts are located between observer's measurements.

