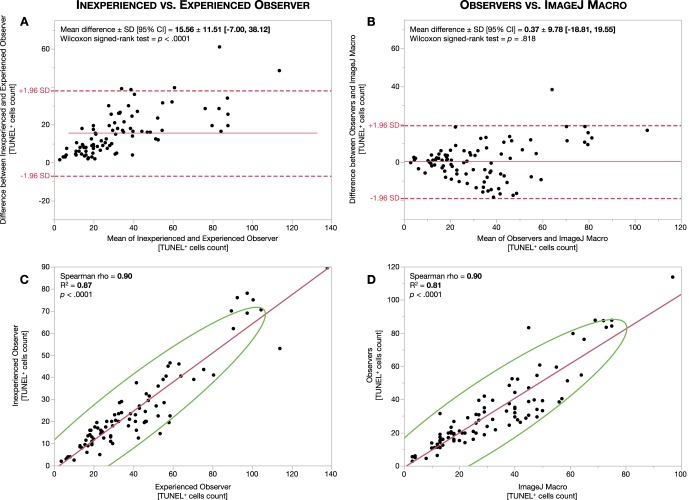
Figure 3.
Outer nuclear layer inter-observer agreement and correlation. Bland-Altman plots for ONL measurement agreement between observers (A) and between observers and ImageJ macro (B) are shown. Red lines represent mean differences or bias. Red dashed lines represent 95% limit of agreement (±1.96 SD). Correlation analysis between observers (C) and between observers and ImageJ macro (D). Red lines represent the fitted linear regression trendline. Green lines represent the 95% confidence interval area.

