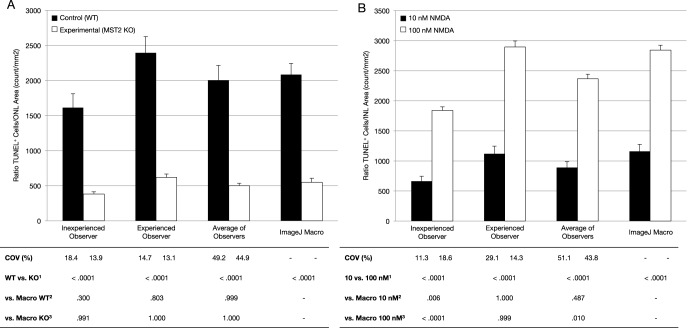
Figure 5.
Experimental testing of ImageJ macro. From the ONL dataset, 30 images from a WT control group and 30 from an experimental (MST2 knock-out) group were selected (A). From the INL dataset, 30 images from a 10 nM NMDA group and 30 from a 100 nM NMDA group were selected (B). Columns represent mean and standard errors of the mean values for the TUNEL+ cells-to-area per observer ratio. 1Wilcoxon signed rank test between groups within the same observer. 2One-way ANOVA with Tukey post hoc correction for comparison between all control groups or 10 nM against the macro. 3One-way ANOVA with Tukey post hoc correction for comparison between all experimental groups or 100 nM against the macro.

