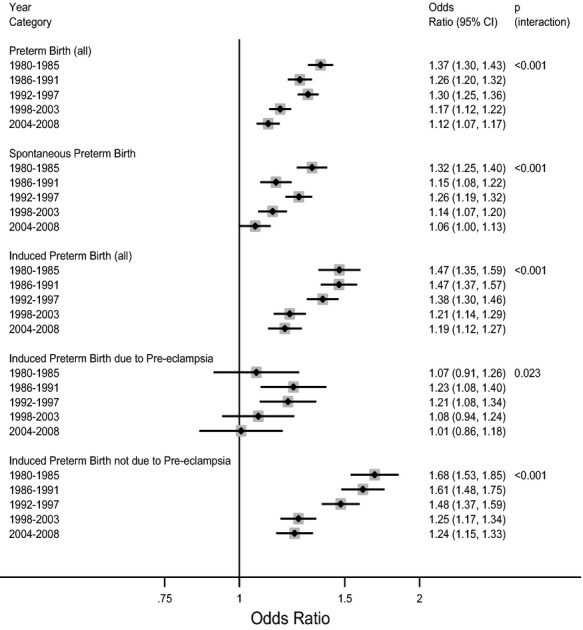
Figure 2.

Adjusted odds ratios for preterm first birth subtypes in Scotland from 1980 to 2008, stratified by year categories. Preterm birth subtypes that were not the outcome of interest were not included in the analyses. Odds ratios adjusted for deprivation status, maternal age, marital status, previous and pregnancy termination. The P value for interaction is from a Wald test of the null hypothesis that the odds ratios did not significantly differ across the period 1980–2008, where year is treated as a continuous variable. Adjusted odds ratio for a one-unit increase in miscarriage (coded as 0, 1, 2, and 3 or more) in relation to risk of: all-cause preterm first births among 732 719 women; spontaneous preterm first births among 717 214 women; all induced preterm first births among 702 257 women; induced preterm first births with a diagnosis of pre-eclampsia among 691 579 women; and induced preterm first births without a diagnosis of pre-eclampsia among 697 423 women.
