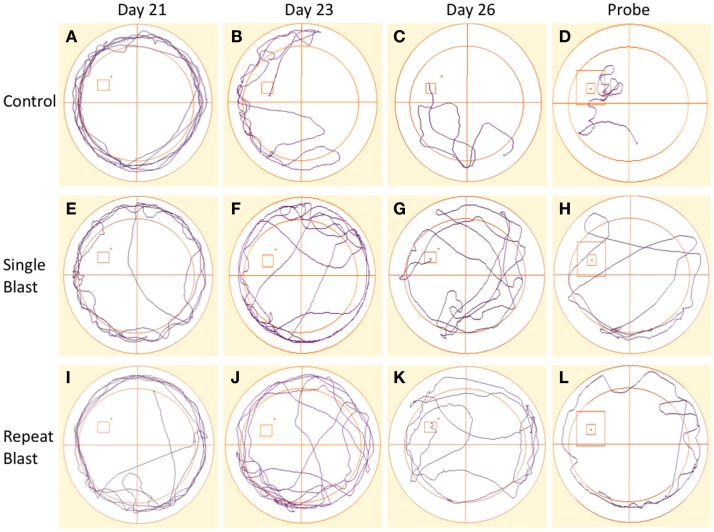
Figure 9.
Track plots acquired across spatial acquisition and probe testing in rats. (A–D) Track plots generated from anesthetized control animals on days 21, 23, 26, and during the probe test. (E–H) Track plots generated from single-injured animals on days 21, 23, 26, and during the probe test post-injury. (I–L) Track plots generated from repetitively injured animals on days 21, 23, 26, and during the probe test post-injury. Injured animals appear to spend more time exhibiting thigmotaxis behaviors (circling edge of pool) on later days and in the probe trial fail to spend as much time as the anesthetized control animals within the probe region and the direct area surrounding the probe region.

