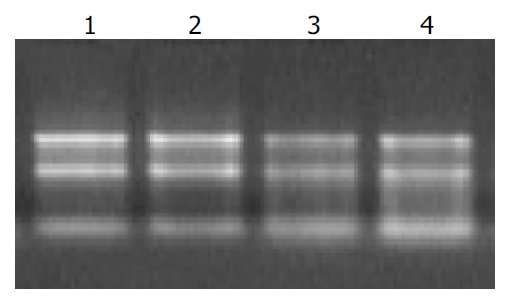
Figure 1.

Ethidium bromide-stained 1% agarose gel of four RNA samples. There were sharp ribosomal bands and mini-mal degradation that was critical for expression analysis. Lanes 1 and 2 represent total RNA derived from SLHCC. Lanes 3 and 4 represent total RNA from NHCC.
