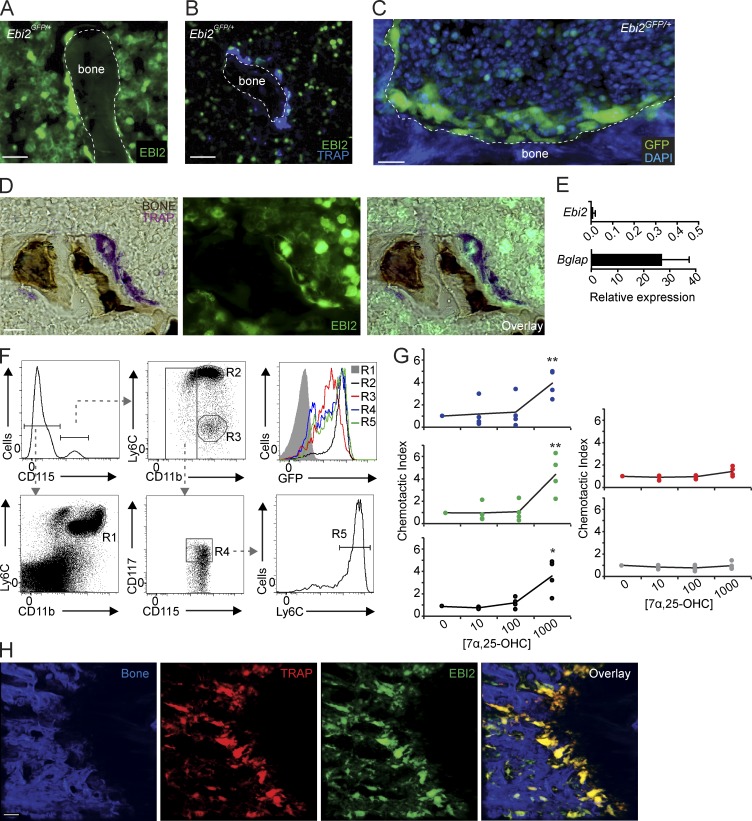
Figure 1.
EBI2 expression and activity in monocytes, OCPs, and mature OCs. (A and B) Fluorescence histochemistry of femur sections of Ebi2GFP/+ mice. (A and B) Distribution of Ebi2-expressing cells (A) and TRAP detection (B). (C) Femurs of Ebi2GFP/+ mice stained to detect nuclear DNA with DAPI detected by two-photon microscopy; Ebi2-expressing cells and bone are shown. (D) TRAP and bone histochemistry of Ebi2GFP/+ sectioned femurs. Images were visualized by light (left) and fluorescence (middle) microscopy. Right panel depicts overlay. (A–D) Data are representative of at least three mice independently analyzed. (E) Ebi2 and Bglap mRNA expression in OB differentiated in vitro. Bars indicate mean ± SD of triplicate measures; three independent experiments. (F) Flow cytometric analyses of EBI2 expression in BM myeloid cell subsets from Ebi2GFP/+ mice. R1, neutrophils; R2, inflammatory monocytes; R3, patrolling Ly6Clo monocytes; R4, MDP cells; and R5, cMoPs. Data are representative of three mice independently analyzed. (G) Transwell migration assay of MDPs (blue), cMoPs (green), inflammatory (black) and patrolling (red) monocytes, and neutrophils (gray) toward a gradient of 7α,25-OHC concentration (nM). Lines indicate mean, and circles depict individual experiments. Data are representative of four mice independently analyzed. (H) Analysis of Ebi2GFP/+ TRAPRed femur; left to right: bone, TRAP+, EBI2-expressing cells, and overlay. Imaged area is 500 × 500 × 100 µm. Data are representative of >10 mice independently analyzed. *, P < 0.05; **, P < 0.01 by unpaired Student’s t test. Bars: (A and B) 30 µm; (C, D, and H) 50 µm. See also Videos 1 and 2.

