Figure 3.
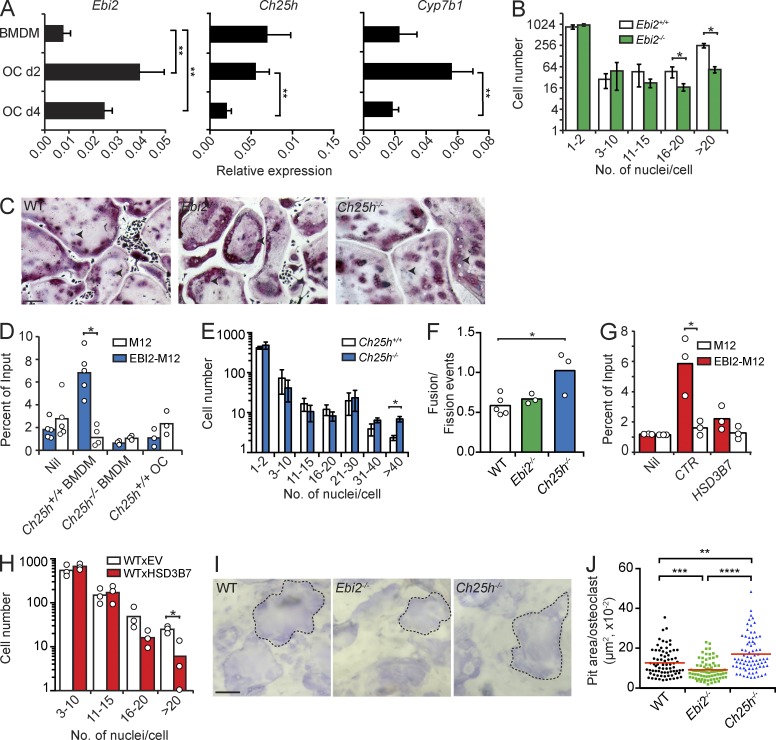
OC differentiation in EBI2 signaling deficiency in vitro. (A) Ebi2, Ch25h, and Cyp7b1 mRNA expression in BMDMs and OCs differentiated for 2 (d2) and 4 d (d4). Bars indicate mean ± SD of triplicate measures, representative of five independent experiments. (B) OC differentiation from EBI2-sufficient and -deficient BMDMs for 4.5 d. (C) Representative TRAP (pink) and nuclei (purple) staining of OCs differentiated from WT, Ebi2−/−, and Ch25h−/− precursors. Black arrowheads indicate individual nuclei (purple). Data are representative of five independent experiments. (D) Migration of M12-EBI2 or control cells toward BMDM culture supernatants. (E) OC differentiation from Ch25h+/+ and Ch25h−/− BMDMs for a period of 4.5 d. (F) Total fusion events relative to fission events after 3 h of time-lapse imaging of WT, Ebi2−/−, and Ch25h−/− OCs on day 4. (G) Migration of M12 cells overexpressing EBI2 or control cells toward supernatants of control (CTR) or HSD3B7-overexpressing BMDMs. (H) OC differentiation from control and HSD3B7-transduced BMDMs for 4.5 d. (I) Light microscopy of bone-resorptive pits formed by WT, Ebi2−/−, and Ch25h−/− OCs. Dashed lines indicate a pit from an individual OC. (J) Quantification of bone pit area/OC. Symbols depict individual pits formed by OCs, and red lines indicate mean. (I and J) Data are representative of three independent experiments. (B and E) OC subsets were distinguished by number of nuclei/cells. Bars indicate mean ± SD of triplicate wells. (D and F–H) Bars indicate the mean, and circles represent mean data from individual mice. (B and D–H) Data are representative of at least three independent experiments. *, P < 0.05; **, P < 0.01; ***, P < 0.001; ****, P < 0.0001 by unpaired Student’s t test. Bars: (C) 100 µm; (I) 50 µm.

