Figure 5.
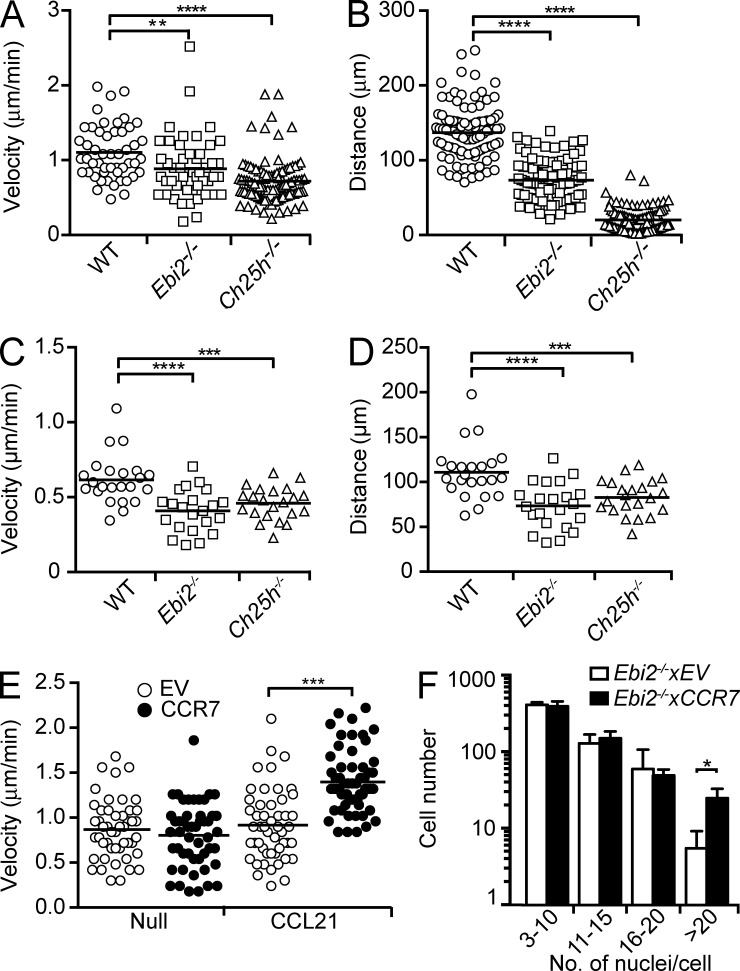
OCP motility in EBI2 signaling deficiency in vitro. (A and B) WT, EBI2-deficient, and CH25H-deficient BMDM median velocity (µm/min; A) and displacement (µm; B). Data are representative of four independent experiments. (C and D) Median velocity (µm/min; C) and displacement (µm; D) of OCs differentiated from WT, Ebi2−/−, and Ch25h−/− OCPs. Each symbol represents the mean of five to eight tracks per OC, and lines indicate mean. Data are representative of three independent experiments. (E) Median velocity (µm/min) of EBI2-deficient BMDMs transduced with control or CCR7-encoding retroviruses, in the absence (null) or presence of 0.5 µg/ml CCL21. Data are representative of three independent experiments. (A–E) Data were collected by time-lapse imaging in vitro; symbols depict single cells, and lines indicate means. (F) OC differentiation from EBI2-deficient control and CCR7-transduced BMDMs for 4.5 d with 0.5 µg/ml CCL21. OC subsets were distinguished by number of nuclei/cell. Bars indicate mean ± SD of triplicate wells. Data are representative of three individual experiments. *, P < 0.05; **, P < 0.01; ***, P < 0.001; ****, P < 0.0001 by unpaired Student’s t test. See also Videos 3 and 4.

