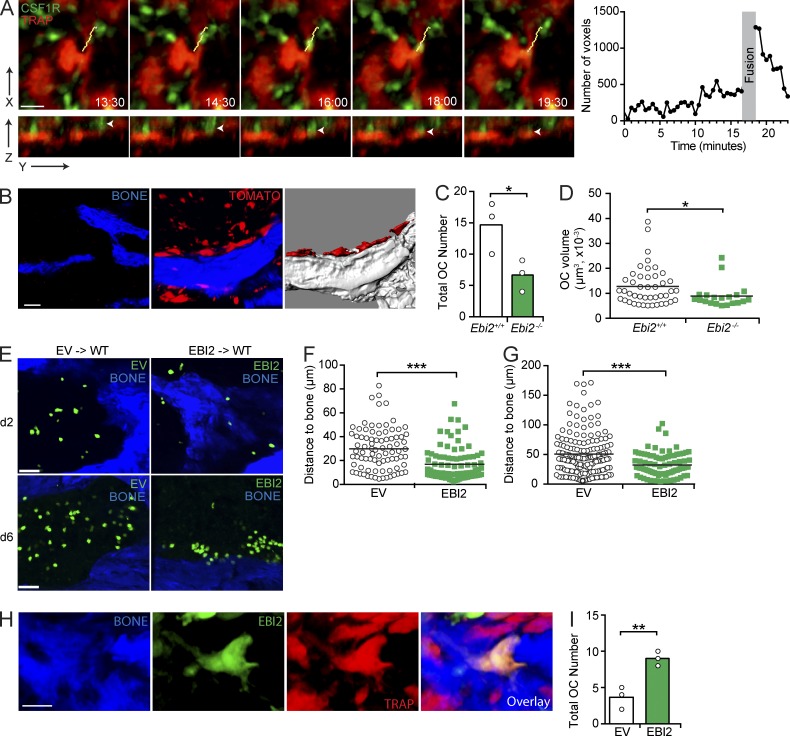
Figure 7.
EBI2 guides OCPs toward bone surfaces. (A, left) Time-lapse sequence of two-photon intravital microscopy of monocyte/OCP (green) fusion with an OC (red). Yellow lines indicate the cell track, and arrowheads indicate an OCP undergoing cell fusion. (right) GFP fluorescence in OCs before and after fusion. (B–D) Transfer of CSF1R+tdTomato+ cells into WT recipients analyzed by two-photon microscopy of femurs. (B, left) BM (black) and bone of control mice. (middle) tdTomato+ cell distribution after transfer. (right) tdTomato+ OCs. (C) OC numbers. (D) OC volumes. (E–G) Control (EV) and EBI2-transduced OCPs transferred into WT for 2 (E and F) or 6 d (E and G), and distance to bone was analyzed by two-photon microscopy of femurs. (D, F, and G) Symbols depict individual cells, and lines represent means. (H and I) Control (EV)- and EBI2-transduced OCPs transferred into TRAPRed mice for 6 d and analyzed by two-photon microscopy of femurs. (H) GFP+ cell fused with an OC. (I) Number of TRAP+GFP+ OCs. (C and I) Bars indicate the mean, and circles depict individual mice. (A–I) Data are representative of three independent experiments. *, P < 0.05; **, P < 0.01; ***, P < 0.001 by unpaired Student’s t test. Bars: (A) 20 µm; (B and E) 50 µm; (H) 24 µm. See also Videos 5 and 6.

