Figure 9.
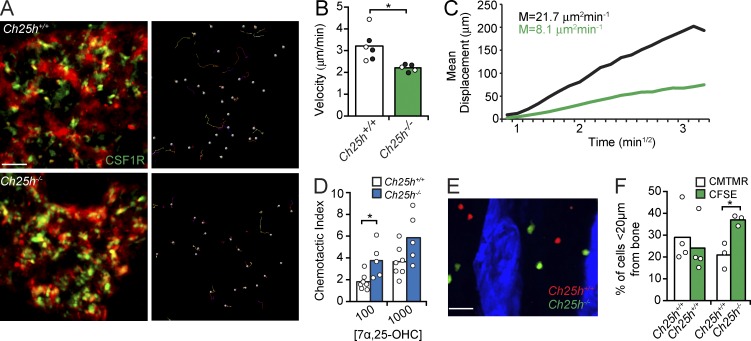
EBI2 signaling controls OCP motility and positioning in BM. (A) Intravital two-photon microscopy of CH25H-sufficient (top) and -deficient (bottom) monocytes/OCPs in vivo. (left) CSF1R+ cells and vasculature (red). (right) Cell tracks. Data are representative of six independent experiments. (B and C) Median velocity (B) and motility coefficient (M; C) of CH25H-sufficient and -deficient monocytes/OCPs. Circles indicate individual mice: CSF1R-GFP, white; and Cx3cr1GFP/+, black. Data are representative of six experiments. (D) CH25H-sufficient or -deficient monocyte/OCP migration toward 7α,25-OHC (nM). Data are representative of six experiments. (E) BM distribution of adoptively transferred CH25H-sufficient (red) and CH25H-deficient (green) monocytes/OCPs. (F) Monocyte/OCP frequency <20 µm distal from bone. Data were pooled from four experiments. (B, D, and F) Bars indicate mean, and circles represent individual experiments and/or mice. *, P < 0.05 by unpaired Student’s t test. Bars: (A) 50 µm; (E) 30 µm. See also Video 7.

