Figure 1.
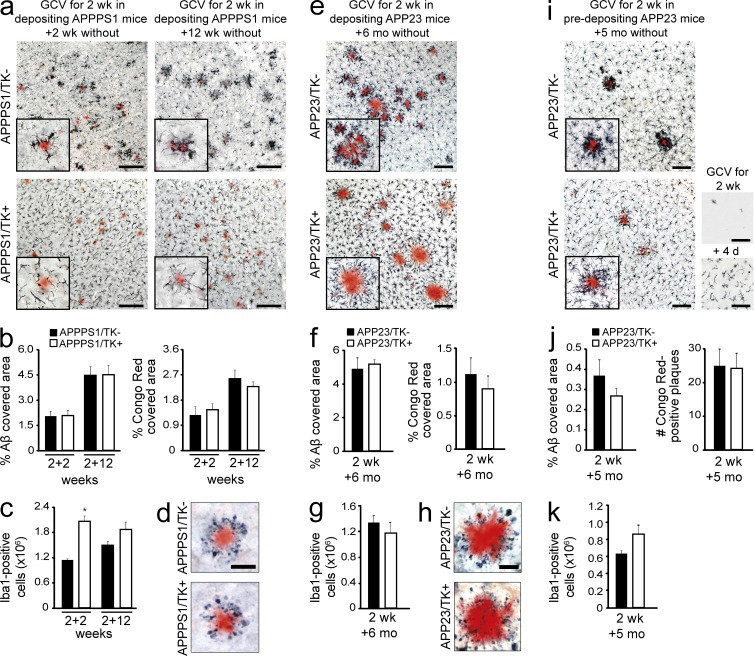
Long-term myeloid cell replacement does not alter Aβ deposition. Analysis of the effects of myeloid cell replacement in two APP transgenic mouse models, APPPS1 and APP23. (a) Brain-resident myeloid cells were ablated in 3-mo-old, depositing APPPS1 mice, which then remained untreated for 2 or 12 wk. Immunostaining shows Iba1-positive myeloid cells and amyloid plaques (Congo red) in APPPS1/TK− mice (top) and APPPS1/TK+ mice (bottom). (b) Stereological quantification of congophilic deposits (Congo red staining) and total Aβ load (anti-Aβ staining) at 2 or 12 wk after GCV treatment in APPPS1/TK− mice compared with repopulated APPPS1/TK+ animals. (c) Stereological analysis of total Iba1+ cells in APPPS1/TK+ compared with APPPS1/TK− mice (ANOVA: transgene × time point interaction, F(3,25) = 6.417, P < 0.001; Tukey’s HSD post hoc: *, P < 0.05). (d) Amyloid-associated neuritic dystrophy in APPPS1/TK+ and APPPS1/TK− mice (Congo red and APP staining). (e) 9-mo-old, depositing APP23/TK mice received GCV treatment and then remained untreated for 6 mo. Immunostaining shows Iba1-positive myeloid cells and amyloid plaques (Congo red). (f) Stereological quantification of congophilic deposits and total Aβ load. (g) Stereological analysis of cortical Iba1-positive cells in APP23/TK− compared with APP23/TK+ mice. (h) Amyloid-associated neuritic dystrophy in APP23/TK+ and APP23/TK− mice (Congo red and APP staining). (i) APP23/TK mice at 5 mo of age, i.e., before onset of plaque deposition, received GCV treatment and then remained untreated for 5 mo. Immunostaining shows Iba1-positive myeloid cells and amyloid plaques (Congo red). (bottom right, top picture) Iba1 staining after initial depletion; (bottom picture) myeloid cell morphology upon invasion. (a, e, and i) Insets show higher-magnification images. (j) Stereological quantification of total Aβ load and total number of congophilic deposits in APP23 animals. (k) Quantitative stereological analysis of Iba1-positive cells in APP23/TK+ and APP23/TK− animals. Bars: (a, e, and i) 100 µm; (d and h) 50 µm. Data were pooled from at least two independent experiments. Analyses were performed in a–d for APPPS1/TK−: n = 7/8 males and APPPS1/TK+: n = 6/5 males for the 2+2/2+12 wk time points, respectively; in e–h for APP23/TK+: n = 4 females, 3 males and APP23/TK−: n = 4 females, 2 males; and i–k for APP23/TK+: n = 4 males and APP23/TK−: n = 7 males. Immunostainings were independently replicated at least two times. Data are presented as mean ± SEM.

