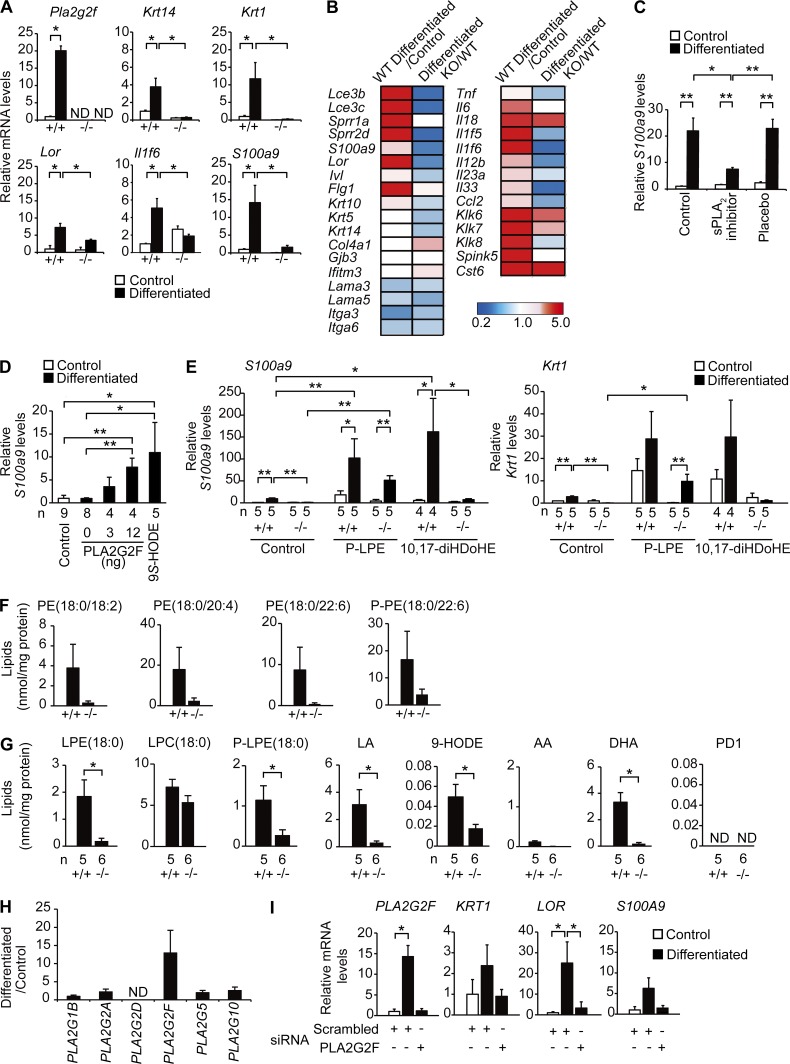
Figure 4.
Impaired differentiation and activation of Pla2g2f−/− keratinocytes. (A) Quantitative RT-PCR of Pla2g2f and keratinocyte markers in Pla2g2f+/+ and Pla2g2f−/− keratinocytes after culture for 2 d with (differentiated) or without (control) 1 mM CaCl2 (n = 5). (B) Microarray gene profiling of Pla2g2f+/+ (WT) and Pla2g2f−/− (KO) keratinocytes. Ratios of differentiated to control cultures in WT cells and those of KO to WT cells after differentiation are shown. The heat maps are globally normalized for all genes and the color code shows signal intensity. (C–E) Quantitative RT-PCR of S100a9 or Krt1 after 2-d culture of WT cells with 10 nM sPLA2 inhibitor or placebo (n = 5; C), KO cells with various doses of PLA2G2F or 10 nM 9S-HODE (n = 5; D), or WT and KO cells with 10 nM P-LPE or 10,17-diHDoHE (n = 5; E). (F and G) ESI-MS of phospholipids (F) and metabolites (G) in keratinocyte supernatants after differentiation culture for 2 d (n = 5). (H) Quantitative RT-PCR of sPLA2s in human keratinocytes. Fold increases after culture for 2 d with 1 mM CaCl2, with that of PLA2G1B as 1, are shown (n = 6). (I) Quantitative RT-PCR of keratinocyte genes in human keratinocytes that were pretreated with PLA2G2F or scrambled siRNA, and then cultured with or without 1 mM CaCl2 for 2 d (n = 4). In A, C-E, and I, expression was normalized with Rn18s, the values for the control culture being 1. Data are from one experiment (B and C) or are representative of two (H and I) or three (A and D–G) experiments (mean ± SEM; *, P < 0.05; **, P < 0.01). ND, not detected.

