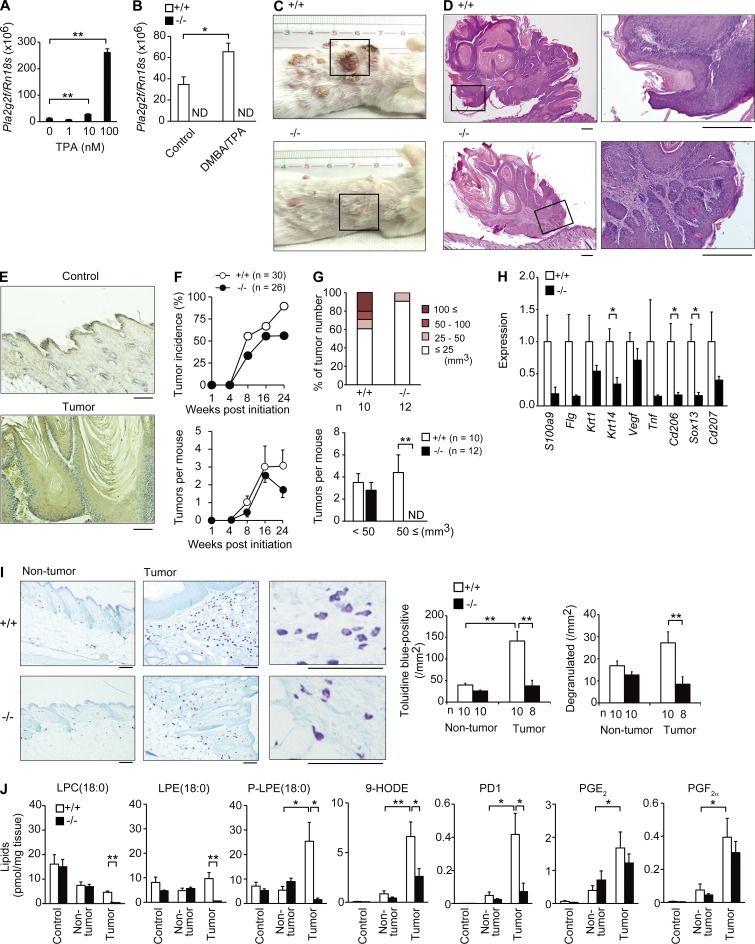
Figure 9.
Reduced skin carcinogenesis in Pla2g2f−/− mice. (A and B) Quantitative RT-PCR of Pla2g2f in WT keratinocytes 48 h after treatment with TPA (n = 6; A) or in Pla2g2f+/+ and Pla2g2f−/− skins (BALB/c background) 4 wk after treatment with or without DMBA/TPA (n = 6; B). (C and D) Gross appearances of Pla2g2f+/+ and Pla2g2f−/− mice (C) and hematoxylin-eosin staining of skin tumors (D) at 24 wk (bar, 100 µm). Boxes are magnified in the right panels (D). (E) Immunohistochemistry of PLA2G2F in tumor and nontumor areas of DMBA/TPA-treated WT skin at 24 wk. (F and G) Monitoring of tumor incidence, numbers (F), and sizes (G) in DMBA/TPA-treated Pla2g2f+/+ and Pla2g2f−/− skins (n = 9). (H) Quantitative RT-PCR of keratinocyte or immune cell genes in DMBA/TPA-treated Pla2g2f+/+ and Pla2g2f−/− skins at 24 wk, the expression levels in WT being 1 (n = 6). (I) Toluidine blue staining of skin mast cells at 24 wk. Right panels show magnified views, in which degranulated mast cells were frequently seen in Pla2g2f+/+, but not in Pla2g2f−/−, mice. Total and degranulated mast cells were counted (bar, 100 µm). (J) ESI-MS of lipid metabolites in Pla2g2f+/+ and Pla2g2f−/− skins 24 wk after treatment with (nontumor and tumor) or without (control) DMBA/TPA (n = 6). Data are compiled from two (B) or three experiments (F–H and J) or from one (A) or two (I) experiments (mean ± SEM; *, P < 0.05; **, P < 0.01). Representative images are shown (C–E and I). ND, not detected.

