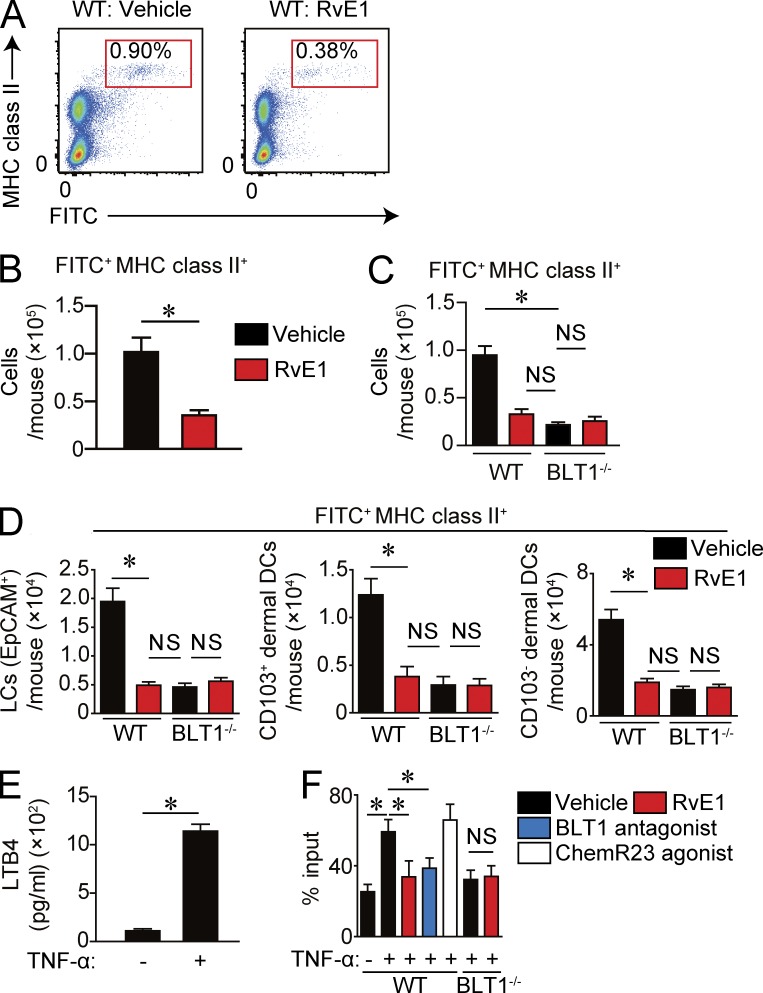
Figure 1.
Inhibition of DC migration in the inflammatory state by RvE1 or a BLT1 antagonist. (A–C) FITC-induced DC migration assay. (A) Representative FACS plots of FITC+ MHC class II+ cells in dLNs. Mice were treated with either vehicle or RvE1 (200 ng/mouse) 30 min before and 1 d after FITC application. LN cell suspensions were prepared from dLNs 48 h after FITC application and subjected to a flow cytometric analysis. (B) Number of migrated FITC+ MHC class II+ DCs in dLNs (n = 4). (C) Number of migrated DCs in WT and BLT1-deficient mice (n = 3). (D) Number of migrated FITC-positive Langerhans cells (EpCAM+), CD103+ dermal DCs, and CD103− dermal DCs in WT and BLT1-deficient mice (n = 3). (E) LTB4 production by BMDCs after TNF stimulation. BMDCs were stimulated with 100 ng/ml TNF for 12 h, and the LTB4 concentration in culture supernatant was measured by ELISA. (F) Transwell migration assay. WT or BLT1-deficient BMDCs pretreated with 100 nM RvE1, 10 nM BLT1 antagonist, or 100 µM ChemR23 agonist were incubated with or without 100 ng/ml TNF and examined for chemotaxis to 100 ng/ml CCL21. The migrated BMDC number was evaluated by flow cytometry. Data are presented as the percentage of migrated DCs to total input. Results are expressed as the mean ± SEM. All p-values were obtained by Student’s t test: *, P < 0.05. All data are representative of five independent experiments with reproducible results.

