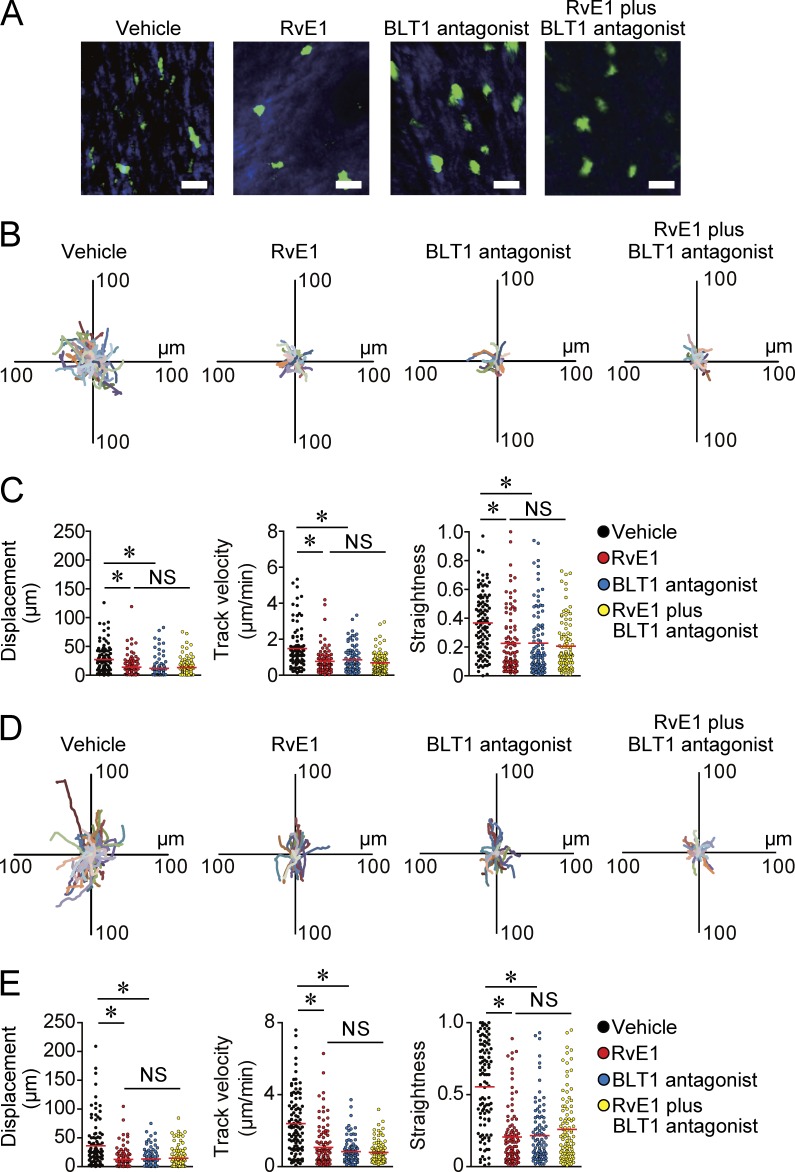
Figure 4.
Inhibition of DC motility in the skin by BLT1 blockade. (A–C) Evaluation of cutaneous DC motility in the steady state skin. (A) Representative images of DC morphology. CD11c-YFP mice were treated with vehicle, RvE1 (200 ng/mouse), a BLT1 antagonist (ONO-4057; 60 µg/mouse), or RvE1 (200 ng/mouse) plus a BLT1 antagonist (60 µg/mouse), and DC morphology was examined 1 h after each drug treatment. Bars, 10 µm. (B) Overlay of 100 individual DC tracks. Superimposed 30-min tracks of 100 randomly selected CD11c-YFP+ cells 1 h after each drug treatment in the x-y plane, setting the starting coordinates to the origin. (C) Comparison of CD11c-YFP+ cell displacement, track velocity, and straightness in B. Each symbol represents an individual cell. (D and E) Evaluation of cutaneous DC motility in the inflammatory state skin. (D) Overlay of 100 individual DC tracks plotted after aligning their starting positions. Ear skin of CD11c-YFP mice were applied with 0.5% DNFB, and the mice were treated with vehicle, RvE1, a BLT1 antagonist, or RvE1 plus a BLT1 antagonist 3 h after the hapten application. Superimposed 30-min tracks of 100 randomly selected CD11c-YFP+ cells 1 h after each drug treatment in the x-y plane. (E) Comparison of CD11c-YFP+ cell displacement, track velocity, and straightness in D. (C and E) Red horizontal lines indicate median values. All p-values were obtained by Welch’s t test: *, P < 0.05. All data are representative of three independent experiments with reproducible results.

