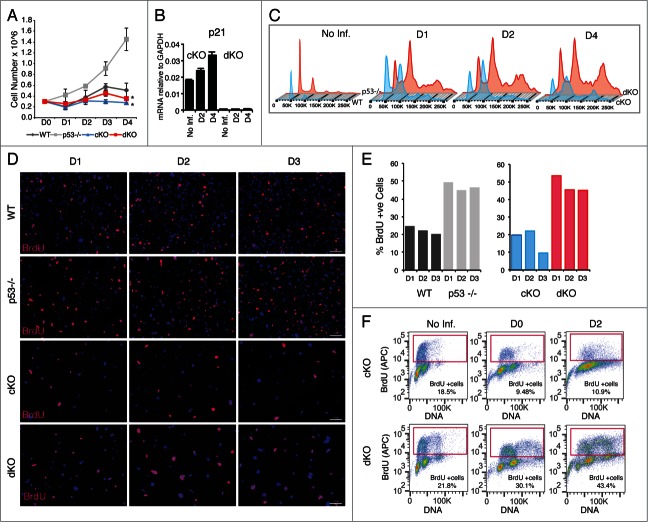
Figure 2.
Ablation of Hinfp in p53 null cells affects cell proliferation and impairs DNA synthesis. (A) Cell growth curves show loss of Hinfp causes severe proliferation defects in both cKO (*p=0.045) and dKO (*p=0.048) cells. Wildtype (WT) cells and p53 null (−/−) cells not treated with Cre were used as comparison. (B) Q-RT-PCR showing relative mRNA levels of p21 in response to loss of Hinfp in the presence (cKO) or absence (dKO) of p53. (C) Cell cycle profiles of cKO and dKO cells exhibit progressive accumulation of polyploid cells after ablation of Hinfp. WT and p53 −/− cells are shown for comparison (left panels). (D) IF microscopy performed on WT, p53 −/−, cKO and dKO cells pulse labeled with BrdU (red). Nuclei are stained with DAPI (blue). cKO cells at D3 show a substantial decrease in BrDU incorporation, while dKO cells lacking both Hinfp and p53 show much higher frequency of BrdU incorporation. Scale Bar 100µM. (E) Quantification of BrdU incorporation. The bar graphs show percentage of cells engaged in active DNA synthesis as calculated by counting of BrdU positive cells. (F) FACS analysis of cells pulse-labeled with BrdU using BrdU-APC kit for quantitative measurements of percent S-phase in cKO and dKO cells. Note the substantial increase in the fraction of BrdU +cells after removal of both p53 and Hinfp at D2.

