FIGURE 1.

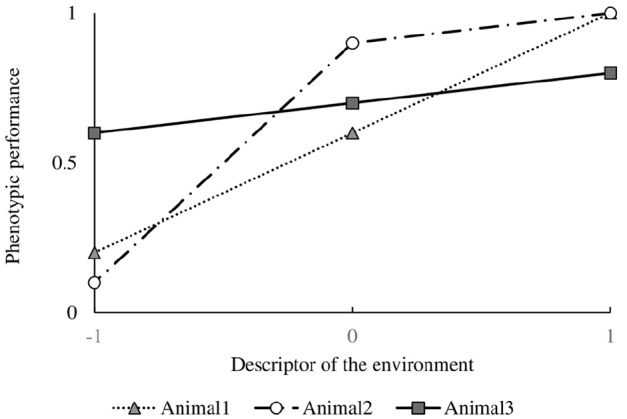
Phenotypic performance of three different (imaginary) genotypes as a function of an environmental gradient at values –1 (an unfavorable environment), 0 (a “neutral” environment) and 1 (a favorable environment).

Phenotypic performance of three different (imaginary) genotypes as a function of an environmental gradient at values –1 (an unfavorable environment), 0 (a “neutral” environment) and 1 (a favorable environment).