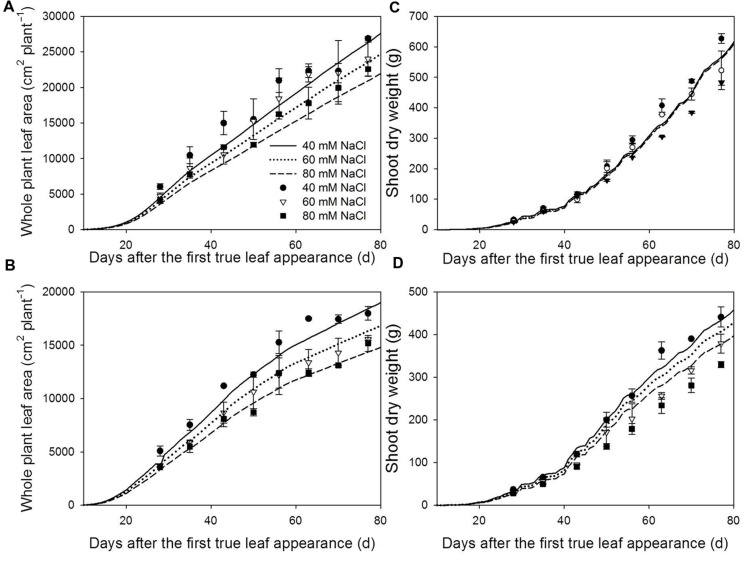
FIGURE 3.
Measured (symbols) and simulated (lines) total plant leaf area (A,B) and shoot dry weight (C,D) at 22/18°C (LT, A,C) and 32/28°C (HT, B,D) day/night temperature regimes under 40 (circles), 60 (triangles) and 80 (squares) mM NaCl. The measured and simulated total leaf area and shoot dry weight of non-stress plants can be found in Chen et al. (2014). Measured data are from the plants grown in the experiment for model evaluation (n = 4). The simulated shoot dry weights were the results with the reference light use efficiency [𝜀(Iabs(t)) in Eq. 1].

