
Table 1.
Population, insurance status, and the need for STD services for uninsured men and women aged 15–44 years in the United States, by age and race/ethnicity, 2006–2010
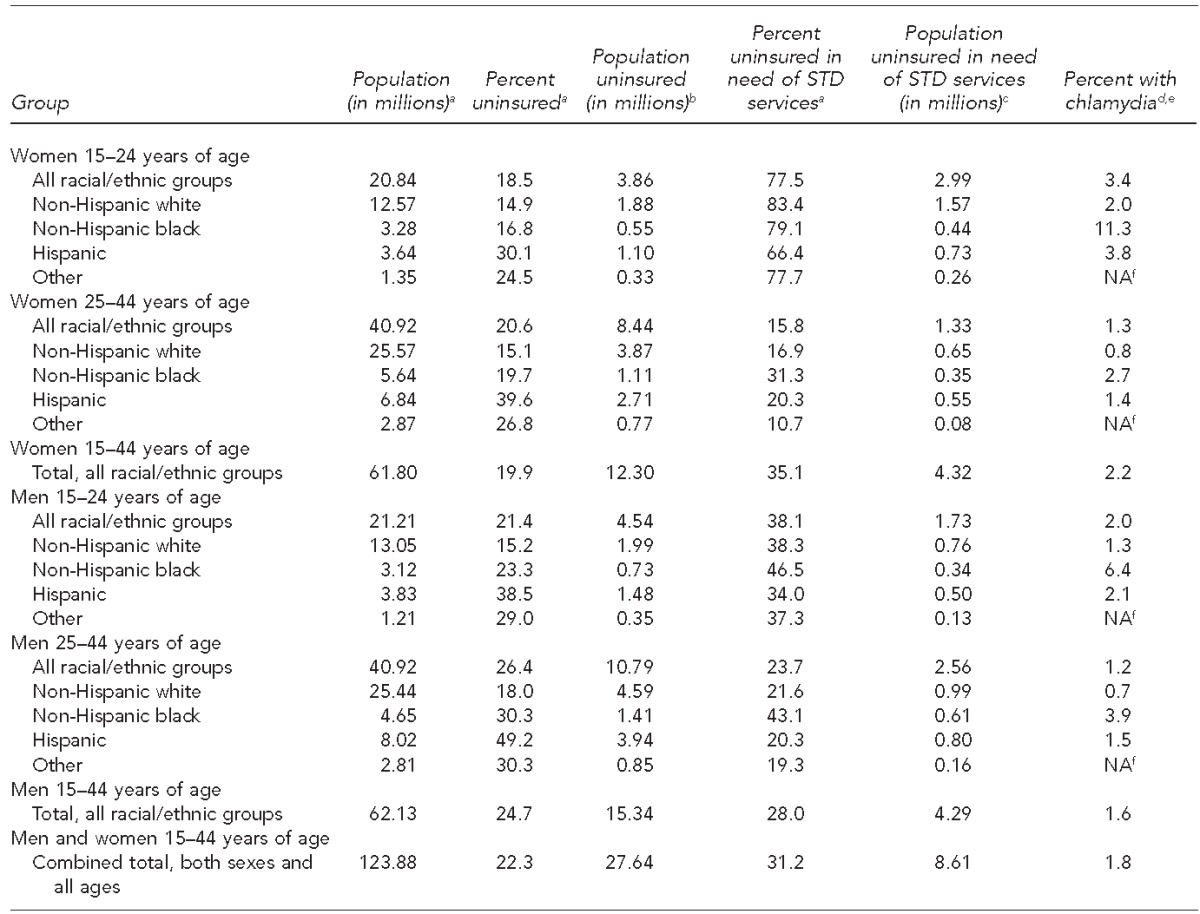
aData source: Centers for Disease Control and Prevention (US). National Survey of Family Growth, 2006–2010 [cited 2015 Aug 25]. Available from: URL: http://www.cdc.gov/nchs/nsfg/nsfg_2006_2010_puf.htm
bPopulation uninsured (in millions) was calculated by multiplying population (in millions) by percent uninsured.
cPopulation needing STD services was defined as women aged 15–24 years with ≥1 sex partner within the last 12 months or aged 25–44 years with >1 sex partner within the last 12 months or pregnant, or men with ≥1 male sex partner or >1 sex partner within the last 12 months. Data source: Centers for Disease Control and Prevention (US). National Survey of Family Growth, 2006–2010 [cited 2015 Aug 25]. Available from: URL: http://www.cdc.gov/nchs/nsfg/nsfg_2006_2010_puf.htm
dData source: Centers for Disease Control and Prevention (US). National Health and Nutrition Examination Survey (NHANES), 1999–2010 [cited 2015 Aug 25]. Available from: URL: http://www.cdc.gov/nchs/nhanes/nhanes_questionnaires.htm
eNHANES provides data on chlamydia prevalence for people aged 15–39 years; values in the table assume that the prevalence for people aged 40–44 years equals the prevalence for people aged 25–39 years.
fEstimate unstable due to high relative standard error
STD = sexually transmitted disease
NA = not available