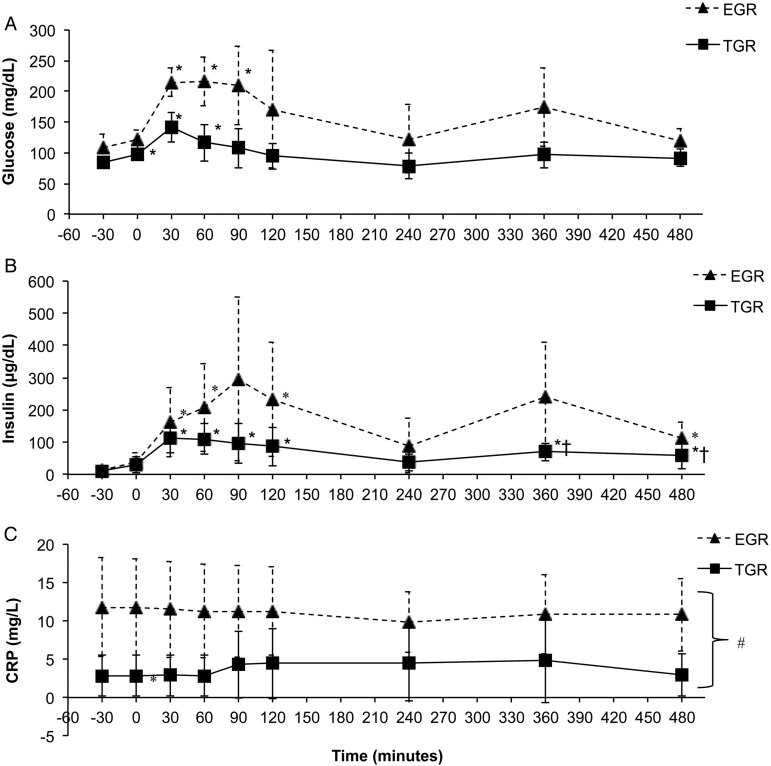
Figure 2 .
Glucose (A), insulin (B), and CRP (C) responses to ingestion of high-fat meals in persons with SCI. Subjects were stratified by exaggerated glucose response (EGR) and typical glucose response (TGR). Meals were consumed at 0 and 240 minutes. Values are mean ± SD. *Significant difference compared to −30 minutes (P < 0.05). †Significant difference compared to 240 minutes (P < 0.05). #Significant main effect for group (P < 0.05).

