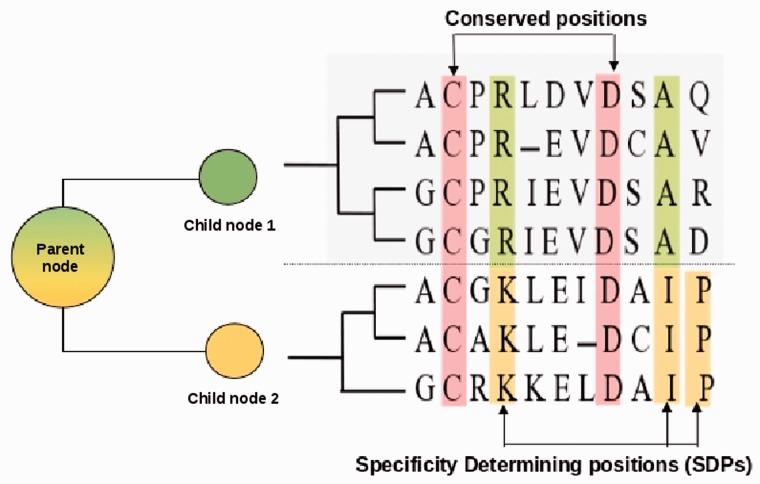
Fig. 1.
Use of SDPs by FunFHMMer to infer functional coherence of cluster alignments. The coloured circles represent the node sequence clusters and each colour denotes a unique function. The schematic representation of the parent node MSA and the child nodes MSA is shown along with the phylogenetic tree. Child nodes are separated by a dashed line. Conserved positions in the MSA are shown in red and the SDPs are shown in green or yellow for different child nodes

