
Figure 1. The Presence of NK Cell Subsets Devoid of FcɛRγ, SYK, and EAT-2 Expression Is Associated with Cytomegalovirus Infection.
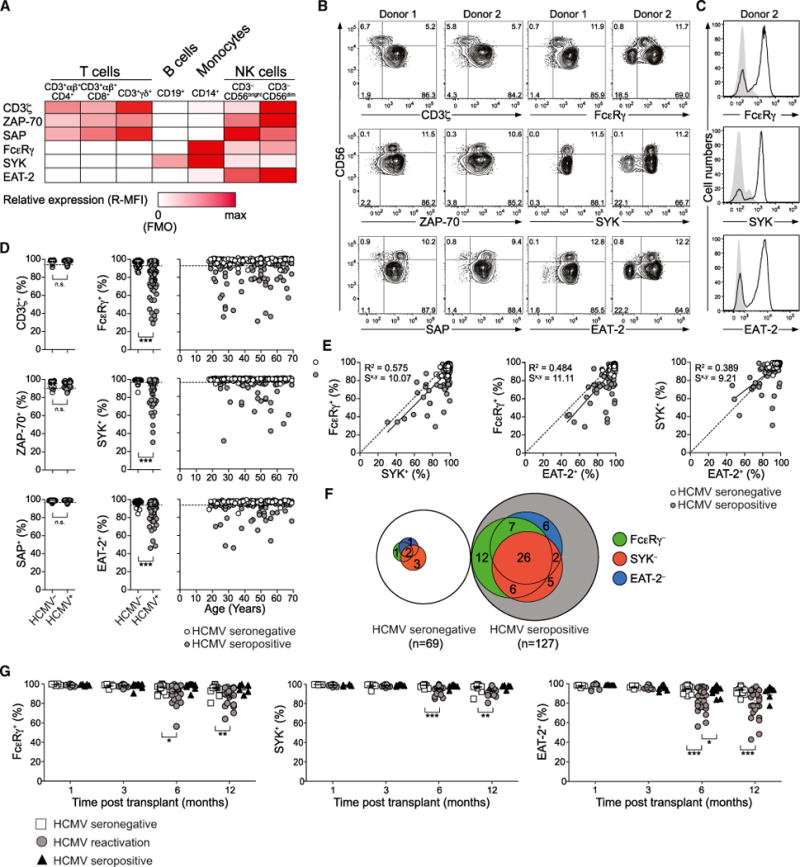
(A–F) PBMCs from healthy human blood donors were analyzed by flow cytometry.
(A) Relative median fluorescence intensity (MFI) of CD3ζ, ZAP-70, SAP, FcɛRγ, SYK, and EAT-2 expression in immune cell subsets. Data represent mean MFI values from three donors.
(B) Expression of CD3ζ, ZAP-70, SAP, FcɛRγ, SYK, and EAT-2 in CD3−CD56dim NK cells from two representative donors.
(C) Expression of FcɛRγ, SYK, and EAT-2 in CD4+ T cells (filled histograms) and CD3−CD56dim NK cells (black lines) in a representative donor lacking signaling proteins.
(D) Frequency of CD3−CD56dim NK cells expressing CD3ζ, ZAP-70, SAP, FcɛRγ, SYK, and EAT-2 from 196 healthy donors versus age of the individuals. HCMV− (open circles) and HCMV+ (filled circles) individuals are indicated. Dotted lines indicate a threshold for outliers calculated as the mean of HCMV− individuals plus 3 SD. ***p < 0.001 (Mann-Whitney test).
(E) Relationship between the frequencies of CD3−CD56dim NK cells expressing FcɛRγ, SYK, or EAT-2. Solid lines represent the correlation for HCMV+ individuals only. The coefficient of determination (R2) and standard error of estimate (Sx,y) values for HCMV+ individuals are indicated.
(F) Relationship between donors with CD3−CD56dim NK cells lacking FcɛRγ (green), SYK (red), or EAT-2 (blue) expression among HCMV+ and HCMV− donors. See also Figure S1.
(G) PBMCs from 78 allogeneic hematopoietic cell transplant patients with a total of 37 HCMV reactivation events were analyzed by flow cytometry for intracellular FcɛRγ, SYK, and EAT-2 expression within the CD3−CD56dim NK cell subset at 1, 3, 6, and 12 months after transplant. Transplant patients were monitored weekly for HCMV reactivation, which occurs between 30 and 90 days after transplant, by PCR for HCMV DNA copy number. *p < 0.05, **p < 0.01, and ***p < 0.001 (Student’s t test).