
Figure 2. FcɛRγ−, SYK−, and EAT-2− NK Cells Display an Adaptive NK Cell Phenotype.
(A–C) PBMCs from 196 healthy human blood donors were analyzed by flow cytometry. The relationship between the frequencies of CD3−CD56dim NK cells expressing NKG2C (A) or NKp30 (B) versus FcɛRγ, SYK, and EAT-2. Solid lines represent the correlation for HCMV+ individuals only. The coefficient of determination (R2) and standard error of estimate (Sx,y) values for HCMV+ individuals are indicated. Relationship (C) between donors with CD3−CD56dim NK cells lacking FcɛRγ, SYK, and/or EAT-2 expression (black) versus displaying elevated NKG2C expression (light gray) among HCMV+ and HCMV− donors.
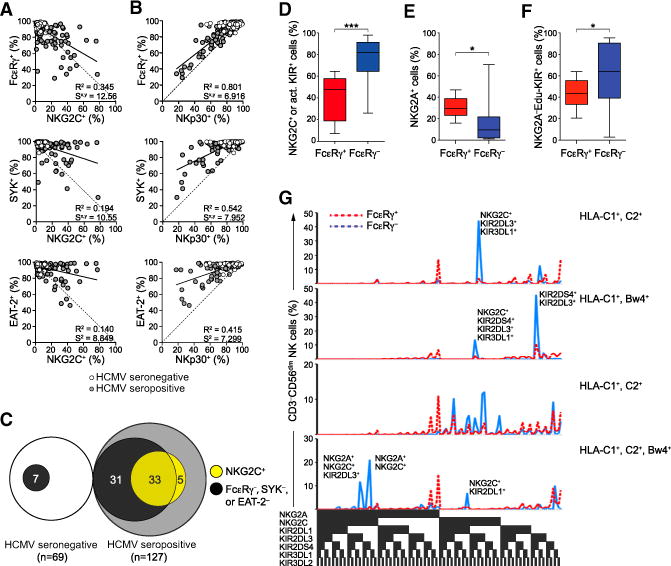
(D–G) PBMCs from 15 healthy KIR haplotype A donors were analyzed by flow cytometry
(D–F) Percentages of CD3−CD56dim NK cells expressing DAP12-coupled receptors NKG2C and/ or KIR2DS4 (D), inhibitory NKG2A (E), or educating KIRs without NKG2A (F). Bars indicate SD.
(G) The distributions of CD3−CD56dim NK cells expressing specific KIRs, NKG2A, and NKG2C in four HLA-typed individuals are shown. *p < 0.05 and ***p < 0.001 (Student’s t test).
See also Figure S2.