
Figure 1. Vibrio cholerae O1 El Tor A1552 membrane vesicles.
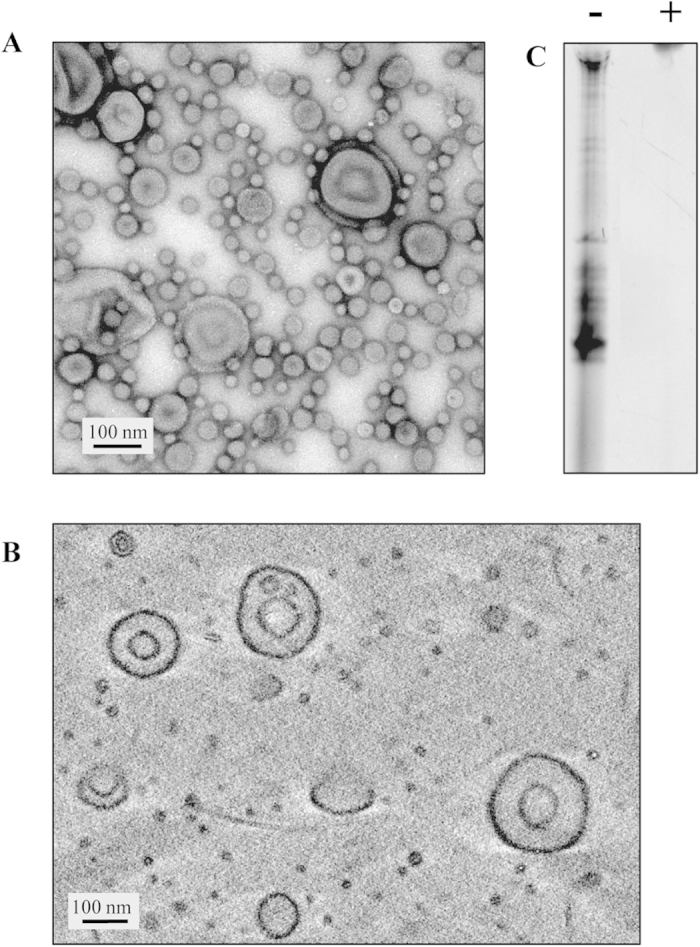
(A) Negative staining micrograph of purified vesicles before hot phenol treatment. Bar: 100 nm. (B) Cryo-electron tomogram of purified vesicles. The image shows a projection of 10 sections corresponding to 6 nm in the centre of the tomogram volume. (C) Polyacrylamide denaturing gel (12%) with 10 μg DNase-treated samples after (–); No RNase treatment, (+); RNase treatment.