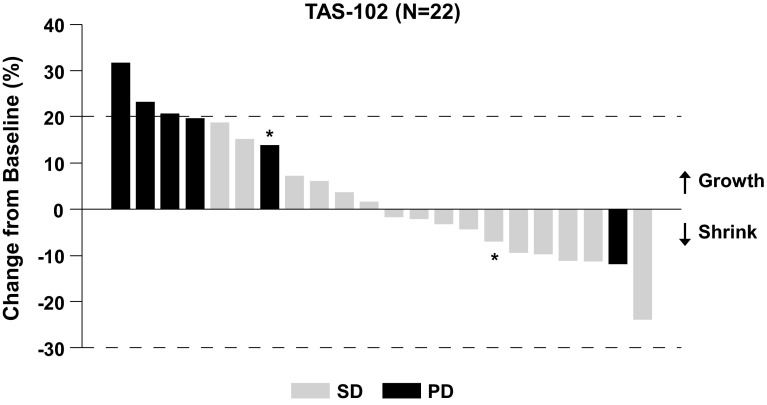
Fig. 2.
Waterfall plot of target lesion change and best overall response. The asterisks denote patients who received TAS-102 at a dose of 30 mg/m2 twice daily. Four patients in the efficacy population did not have all target lesions evaluated post-baseline and are excluded from this graph. The second bar from the right denotes a patient who had progressive disease due to development of a new lesion despite shrinkage of the target lesion

