Figure 1.
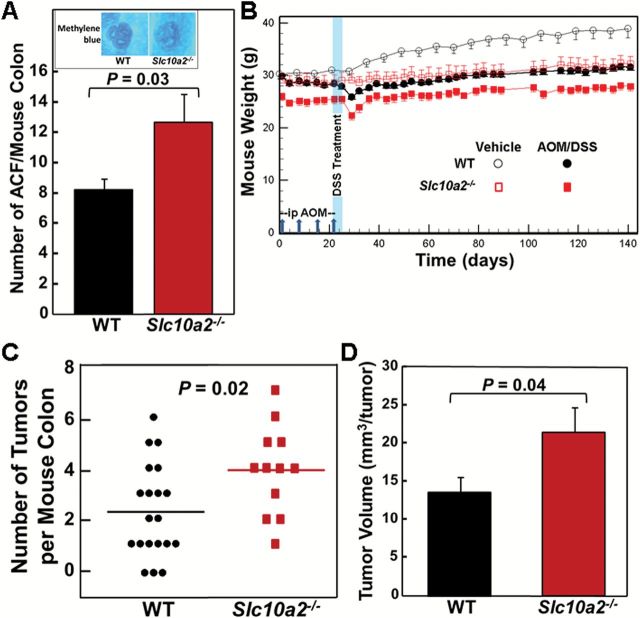
Asbt deficiency promotes colon neoplasia. (A) Colons were harvested from 11 WT and 10 Slc10a2 −/− AOM-treated mice killed 20 weeks after starting AOM injections (7.5mg/kg). Excised colons were stained with methylene blue and examined for ACF. Significantly more ACF were detected in colons from Slc10a2 −/− compared to WT mice (P = 0.03, Student’s unpaired t-test). Error bars denote SEM. Inset: Representative microscopic images of ACF stained with methylene blue. Original magnification, ×40. (B) Experimental design and mouse weights over the course of the 20-week study. Vertical arrows on the horizontal axis indicate intraperitoneal injection with 7.5mg/kg AOM at days 1, 8, 15 and 22. Vertical blue band indicates that 2.5% DSS was added to the drinking water of AOM-treated mice on days 22 through 26. Twenty WT and 15 Slc10a2 −/− mice were treated with AOM plus DSS; three Slc10a2 −/− mice died immediately after DSS treatment. Four WT and three Slc10a2 −/− mice were treated with vehicle alone. Error bars denote SEM. (C) Numbers of colon tumors in WT and Slc10a2 −/− mice treated with AOM plus DSS. Horizontal bars indicate mean numbers of colon tumors, 2.3 and 3.9 tumors per WT and Slc10a2 −/− mouse colon, respectively (P = 0.02). No tumors were observed in colons from WT and Slc10a2 −/− mice treated with vehicle alone. (D) Total tumor volume was calculated in colons from WT and Slc10a2 −/− mice treated with AOM plus DSS. A linear mixed model for repeated measures was applied to compare the logarithm transformed tumor volume between WT mice and ASBT mice. A significant difference between the two groups was found (mean difference in log scale = 0.54, P = 0.04). Error bars denote SEM.

